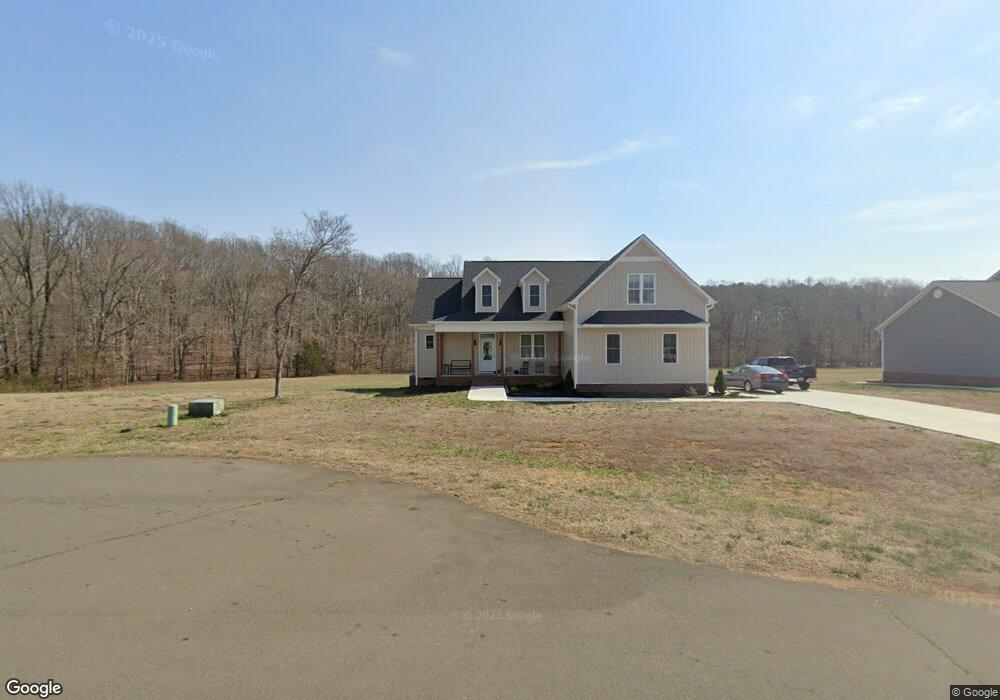
48 Leighann Ct N Timberlake, NC 27583
Estimated Value: $445,000 - $519,000
4
Beds
3
Baths
2,201
Sq Ft
$222/Sq Ft
Est. Value
About This Home
This home is located at 48 Leighann Ct N, Timberlake, NC 27583 and is currently estimated at $488,549, approximately $221 per square foot. 48 Leighann Ct N is a home located in Person County with nearby schools including Person High School.
Ownership History
Date
Name
Owned For
Owner Type
Purchase Details
Closed on
Feb 9, 2024
Sold by
Knight Home Builders Llc
Bought by
Brooks Dallas Ray
Current Estimated Value
Home Financials for this Owner
Home Financials are based on the most recent Mortgage that was taken out on this home.
Original Mortgage
$273,000
Outstanding Balance
$268,175
Interest Rate
6.61%
Mortgage Type
New Conventional
Estimated Equity
$220,374
Purchase Details
Closed on
Oct 5, 2023
Sold by
Knight Home Builders Llc
Bought by
Bell Ronald M and Bell Luann W
Purchase Details
Closed on
May 30, 2023
Sold by
Piner Arthur E
Bought by
Knight Home Builders Llc
Purchase Details
Closed on
Dec 7, 2020
Sold by
Cordell Shirley Ann
Bought by
West John Edward and West Susan H
Purchase Details
Closed on
Sep 23, 2020
Sold by
Diamond Land Development Llc
Bought by
Piner Arthur E
Create a Home Valuation Report for This Property
The Home Valuation Report is an in-depth analysis detailing your home's value as well as a comparison with similar homes in the area
Home Values in the Area
Average Home Value in this Area
Purchase History
| Date | Buyer | Sale Price | Title Company |
|---|---|---|---|
| Brooks Dallas Ray | $473,000 | None Listed On Document | |
| Brooks Dallas Ray | $473,000 | None Listed On Document | |
| Bell Ronald M | $418,000 | None Listed On Document | |
| Bell Ronald M | $418,000 | None Listed On Document | |
| Knight Home Builders Llc | $53,000 | None Listed On Document | |
| West John Edward | $40,000 | None Available | |
| West John Edward | $40,000 | Weinberger Joe | |
| Piner Arthur E | $40,000 | None Available |
Source: Public Records
Mortgage History
| Date | Status | Borrower | Loan Amount |
|---|---|---|---|
| Open | Brooks Dallas Ray | $273,000 | |
| Closed | Brooks Dallas Ray | $273,000 |
Source: Public Records
Tax History Compared to Growth
Tax History
| Year | Tax Paid | Tax Assessment Tax Assessment Total Assessment is a certain percentage of the fair market value that is determined by local assessors to be the total taxable value of land and additions on the property. | Land | Improvement |
|---|---|---|---|---|
| 2025 | -- | $492,900 | $0 | $0 |
| 2024 | -- | $302,883 | $0 | $0 |
| 2023 | $349 | $44,266 | $0 | $0 |
| 2022 | $349 | $44,266 | $0 | $0 |
| 2021 | $0 | $44,266 | $0 | $0 |
| 2020 | $333 | $43,421 | $0 | $0 |
| 2019 | $337 | $43,421 | $0 | $0 |
| 2018 | $316 | $43,421 | $0 | $0 |
| 2017 | $312 | $43,421 | $0 | $0 |
| 2016 | $312 | $43,421 | $0 | $0 |
| 2015 | $312 | $43,421 | $0 | $0 |
| 2014 | $312 | $43,421 | $0 | $0 |
Source: Public Records
Map
Nearby Homes
- 281 Derwin Dr
- 284 Derwin Dr
- 236 Derwin Dr
- 0 Helena Moriah Rd Unit 10101112
- Lot 3 Helena Moriah Rd
- Lot 2 Helena Moriah Rd
- 475 Jim Moore Rd
- 8580 Durham Rd
- 72 Red Field Ln
- 0 Shady Grove Dr Unit Timberlake NC 27583
- 3665 Flat Woods Rd
- 55 Running Deer Path
- 77 Running Deer Path
- 712 Oaks Lane Rd
- 714 Dick Holeman Rd
- Lots 9a/9b Woody Dr
- 60 Forest Dr
- Lot 42 Oak Knob Ct
- 175 Ann Dr
- Lot 19 Tara Ln
- 30 Leighann Ct N
- 12 Leighann Ct N
- 63 Leighann Ct Unit 63
- 63 Leighann Ct Unit 64
- 63 Leighann Ct
- 5 Leighann Ct N
- 63 Leighann Ct N
- 55 Leighann Ct
- 59 Leighann Ct N
- 59 Leighann Ct N
- 59 Leighann Ct N Unit 59 Leighann Court No
- 67 Leighann Ct
- 68 Leighann Ct
- 66 Leighann Ct
- 61 Leighann Ct
- 60 Leighann Ct
- 58 Leighann Ct
- 64 Leighann Ct
- 54 Leighann Ct
- 65 Leighann Ct