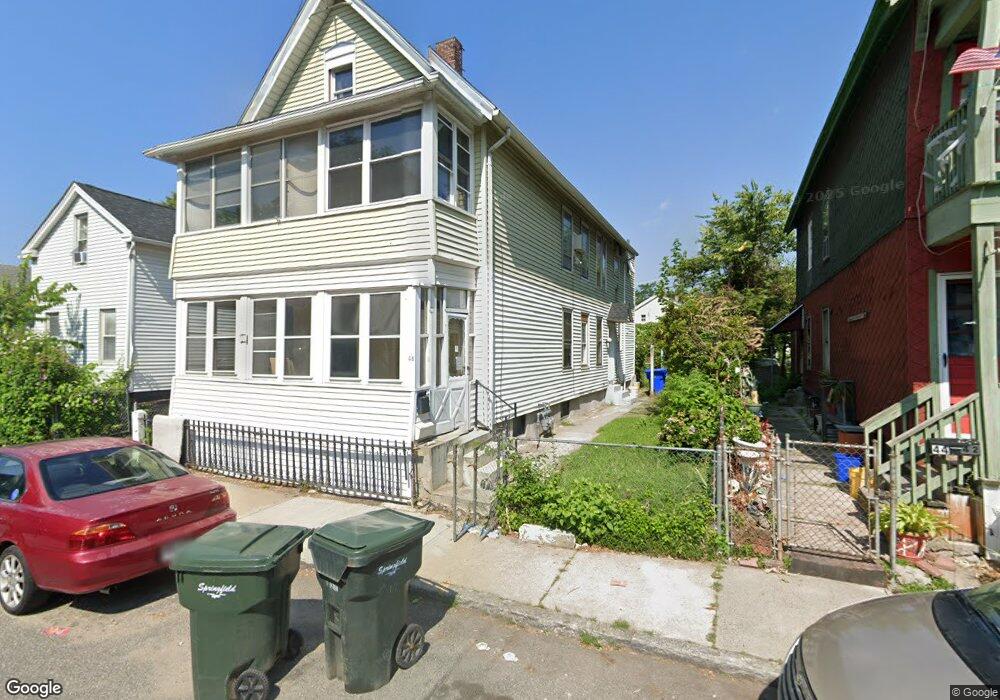
48 Loring St Springfield, MA 01105
South End NeighborhoodEstimated Value: $202,000 - $327,000
5
Beds
2
Baths
2,034
Sq Ft
$123/Sq Ft
Est. Value
About This Home
This home is located at 48 Loring St, Springfield, MA 01105 and is currently estimated at $251,138, approximately $123 per square foot. 48 Loring St is a home located in Hampden County with nearby schools including White Street Elementary School, South End Middle School, and High School Of Commerce.
Ownership History
Date
Name
Owned For
Owner Type
Purchase Details
Closed on
Mar 1, 1993
Sold by
Bengston Rick L and Bengston Linda A
Bought by
Rivera Daniel
Current Estimated Value
Home Financials for this Owner
Home Financials are based on the most recent Mortgage that was taken out on this home.
Original Mortgage
$56,700
Interest Rate
8.03%
Mortgage Type
Purchase Money Mortgage
Create a Home Valuation Report for This Property
The Home Valuation Report is an in-depth analysis detailing your home's value as well as a comparison with similar homes in the area
Home Values in the Area
Average Home Value in this Area
Purchase History
| Date | Buyer | Sale Price | Title Company |
|---|---|---|---|
| Rivera Daniel | $81,000 | -- |
Source: Public Records
Mortgage History
| Date | Status | Borrower | Loan Amount |
|---|---|---|---|
| Open | Rivera Daniel | $20,000 | |
| Closed | Rivera Daniel | $56,700 | |
| Previous Owner | Rivera Daniel | $34,000 |
Source: Public Records
Tax History
| Year | Tax Paid | Tax Assessment Tax Assessment Total Assessment is a certain percentage of the fair market value that is determined by local assessors to be the total taxable value of land and additions on the property. | Land | Improvement |
|---|---|---|---|---|
| 2025 | $2,459 | $156,800 | $24,200 | $132,600 |
| 2024 | $2,592 | $161,400 | $22,700 | $138,700 |
| 2023 | $2,489 | $146,000 | $21,600 | $124,400 |
| 2022 | $2,608 | $138,600 | $19,600 | $119,000 |
| 2021 | $2,597 | $137,400 | $17,900 | $119,500 |
| 2020 | $2,562 | $131,200 | $17,900 | $113,300 |
| 2019 | $2,078 | $105,600 | $17,900 | $87,700 |
| 2018 | $2,068 | $105,100 | $17,900 | $87,200 |
| 2017 | $1,876 | $95,400 | $15,700 | $79,700 |
| 2016 | $1,693 | $86,100 | $15,700 | $70,400 |
| 2015 | $1,709 | $86,900 | $15,700 | $71,200 |
Source: Public Records
Map
Nearby Homes
- 570-582 Main St
- 24 Adams St
- 62 Central St Unit 402
- 82 Central St Unit 304
- 66 Central St Unit 404
- 64 Central St Unit 403
- 72 Central St Unit 407
- 68 Central St Unit 405
- 32 Wendell Place
- 50 Central St Unit 504
- 52 Central St Unit 504
- 61-63 Wilcox St
- 20-22 Acushnet Ave
- 29 Warriner Ave
- 41 Belmont Ave
- 67 Fort Pleasant Ave
- 77 Fort Pleasant Ave
- 43-45 Leyfred Terrace
- 61 Dexter St
- 29 Knox St
- 42 Loring St Unit 44
- 52-56 Loring St
- 60 Loring St
- 49 Fremont St
- 45 Fremont St
- 34 Loring St
- 53 Fremont St Unit 1
- 49-51 Loring St Unit 1
- 49-51 Loring St
- 45 Loring St
- 41 Fremont St
- 49 Loring St Unit 51
- 57 Fremont St
- 55 Loring St
- 35 Loring St Unit 37
- 37 Fremont St
- 30 Loring St Unit 32
- 1007 E Columbus Ave
- 59 Loring St
- 31 Loring St
Your Personal Tour Guide
Ask me questions while you tour the home.