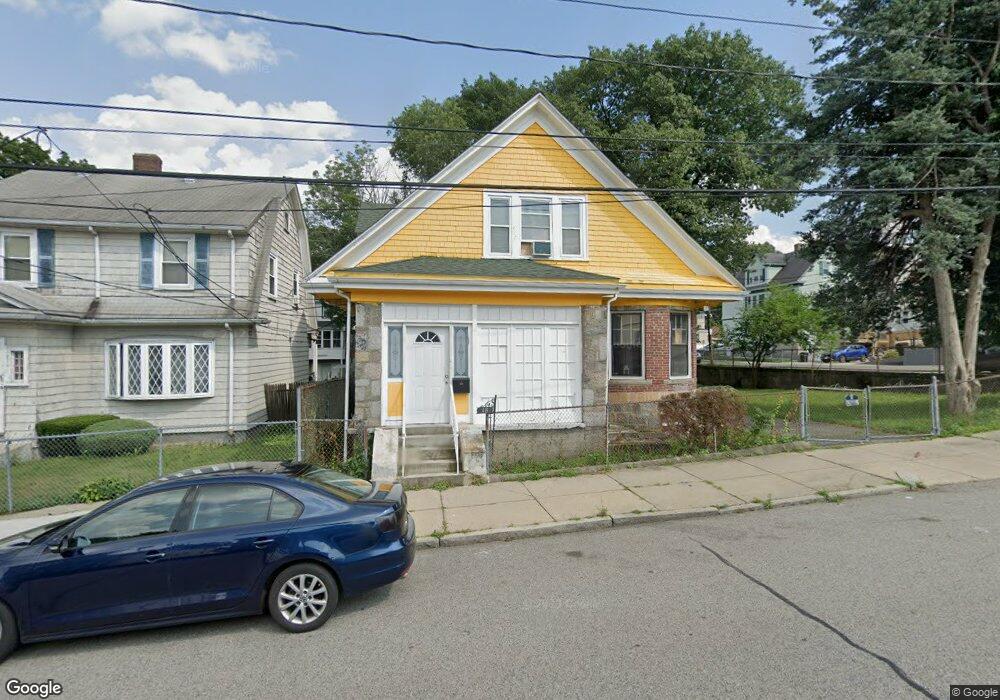
48 Lorna Rd Unit 1 Mattapan, MA 02126
Southern Mattapan NeighborhoodEstimated Value: $519,000 - $737,000
5
Beds
2
Baths
1,689
Sq Ft
$380/Sq Ft
Est. Value
About This Home
This home is located at 48 Lorna Rd Unit 1, Mattapan, MA 02126 and is currently estimated at $641,947, approximately $380 per square foot. 48 Lorna Rd Unit 1 is a home located in Suffolk County with nearby schools including KIPP Academy Boston Charter School and Berea Seventh-day Adventist Academy.
Ownership History
Date
Name
Owned For
Owner Type
Purchase Details
Closed on
Dec 21, 2012
Sold by
Nsp Residential Llc
Bought by
Harris Mari S
Current Estimated Value
Home Financials for this Owner
Home Financials are based on the most recent Mortgage that was taken out on this home.
Original Mortgage
$190,400
Outstanding Balance
$132,288
Interest Rate
3.43%
Mortgage Type
New Conventional
Estimated Equity
$509,659
Purchase Details
Closed on
Aug 30, 2012
Sold by
Greenwich Investors 26
Bought by
Nsp Residential Llc
Purchase Details
Closed on
Jan 24, 2012
Sold by
Harris Mai S
Bought by
Greenwich Investors 26
Purchase Details
Closed on
Jan 20, 1995
Sold by
Chemical Bk T
Bought by
Harris Mai S
Purchase Details
Closed on
Dec 14, 1993
Sold by
Cummings Carlton A and Resolution T Corp
Bought by
Chemical Bk Tr
Create a Home Valuation Report for This Property
The Home Valuation Report is an in-depth analysis detailing your home's value as well as a comparison with similar homes in the area
Home Values in the Area
Average Home Value in this Area
Purchase History
| Date | Buyer | Sale Price | Title Company |
|---|---|---|---|
| Harris Mari S | $235,400 | -- | |
| Nsp Residential Llc | $180,000 | -- | |
| Greenwich Investors 26 | $200,000 | -- | |
| Harris Mai S | $73,000 | -- | |
| Chemical Bank | $40,000 | -- | |
| Chemical Bk Tr | $40,000 | -- |
Source: Public Records
Mortgage History
| Date | Status | Borrower | Loan Amount |
|---|---|---|---|
| Open | Harris Mari S | $190,400 | |
| Previous Owner | Chemical Bk Tr | $240,000 | |
| Previous Owner | Chemical Bk Tr | $202,300 |
Source: Public Records
Tax History Compared to Growth
Tax History
| Year | Tax Paid | Tax Assessment Tax Assessment Total Assessment is a certain percentage of the fair market value that is determined by local assessors to be the total taxable value of land and additions on the property. | Land | Improvement |
|---|---|---|---|---|
| 2025 | $5,265 | $454,700 | $179,300 | $275,400 |
| 2024 | $4,782 | $438,700 | $170,500 | $268,200 |
| 2023 | $4,487 | $417,800 | $162,400 | $255,400 |
| 2022 | $4,288 | $394,100 | $153,200 | $240,900 |
| 2021 | $4,030 | $377,700 | $153,200 | $224,500 |
| 2020 | $3,708 | $351,100 | $144,000 | $207,100 |
| 2019 | $3,459 | $328,200 | $108,300 | $219,900 |
| 2018 | $3,215 | $306,800 | $108,300 | $198,500 |
| 2017 | $3,215 | $303,600 | $108,300 | $195,300 |
| 2016 | $2,904 | $264,000 | $108,300 | $155,700 |
| 2015 | $2,530 | $208,900 | $103,600 | $105,300 |
| 2014 | $2,453 | $195,000 | $103,600 | $91,400 |
Source: Public Records
Map
Nearby Homes
- 15-17 W Selden St
- 124 Selden St
- 30 Glenhill Rd
- 808 Morton St Unit 3
- 139 Selden St
- 18 Astoria St
- 32 Crowell St
- 147 Fairmount St
- 23 Maryknoll St
- 44 Evans St
- 73 Stanton St
- 68 Mascot St
- 10 Sutton St
- 157 Delhi St
- 5 Sutton St
- 5 Sutton St Unit 3B
- 251 Norfolk St Unit A
- 84-86 Codman Hill Ave
- 64 Stockton St
- 81 Mora St