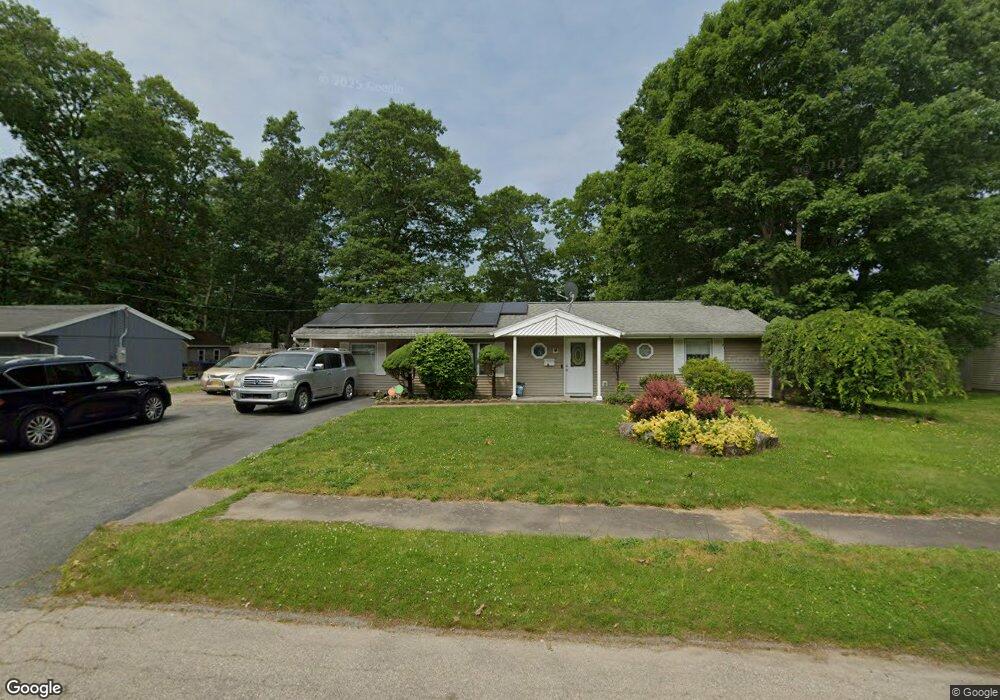
48 Maguire Rd Brockton, MA 02302
Estimated Value: $490,000 - $577,000
3
Beds
1
Bath
1,808
Sq Ft
$296/Sq Ft
Est. Value
About This Home
This home is located at 48 Maguire Rd, Brockton, MA 02302 and is currently estimated at $535,940, approximately $296 per square foot. 48 Maguire Rd is a home located in Plymouth County with nearby schools including Davis K-8 School, John F. Kennedy Elementary School, and South Middle School.
Ownership History
Date
Name
Owned For
Owner Type
Purchase Details
Closed on
Sep 10, 2004
Sold by
Vough Craig M and Vough Tammie I
Bought by
Omeler Nahum
Current Estimated Value
Purchase Details
Closed on
Mar 31, 1999
Sold by
Martin Richard O and Martin Karen J
Bought by
Vough Craig M and Bough Tammie I
Purchase Details
Closed on
Oct 4, 1996
Sold by
Maguire Rd Rt
Bought by
Martin Richard O and Martin Karen J
Create a Home Valuation Report for This Property
The Home Valuation Report is an in-depth analysis detailing your home's value as well as a comparison with similar homes in the area
Home Values in the Area
Average Home Value in this Area
Purchase History
| Date | Buyer | Sale Price | Title Company |
|---|---|---|---|
| Omeler Nahum | $258,000 | -- | |
| Vough Craig M | $132,300 | -- | |
| Martin Richard O | $85,000 | -- |
Source: Public Records
Mortgage History
| Date | Status | Borrower | Loan Amount |
|---|---|---|---|
| Open | Martin Richard O | $203,430 | |
| Closed | Martin Richard O | $91,181 |
Source: Public Records
Tax History Compared to Growth
Tax History
| Year | Tax Paid | Tax Assessment Tax Assessment Total Assessment is a certain percentage of the fair market value that is determined by local assessors to be the total taxable value of land and additions on the property. | Land | Improvement |
|---|---|---|---|---|
| 2025 | $5,263 | $434,600 | $164,700 | $269,900 |
| 2024 | $4,952 | $412,000 | $164,700 | $247,300 |
| 2023 | $4,784 | $368,600 | $115,200 | $253,400 |
| 2022 | $4,482 | $320,800 | $104,700 | $216,100 |
| 2021 | $4,320 | $297,900 | $98,600 | $199,300 |
| 2020 | $4,403 | $290,600 | $85,900 | $204,700 |
| 2019 | $4,141 | $266,500 | $82,600 | $183,900 |
| 2018 | $3,976 | $247,600 | $82,600 | $165,000 |
| 2017 | $3,408 | $211,700 | $82,600 | $129,100 |
| 2016 | $3,573 | $205,800 | $78,700 | $127,100 |
| 2015 | $3,247 | $178,900 | $78,700 | $100,200 |
| 2014 | $3,345 | $184,500 | $78,700 | $105,800 |
Source: Public Records
Map
Nearby Homes