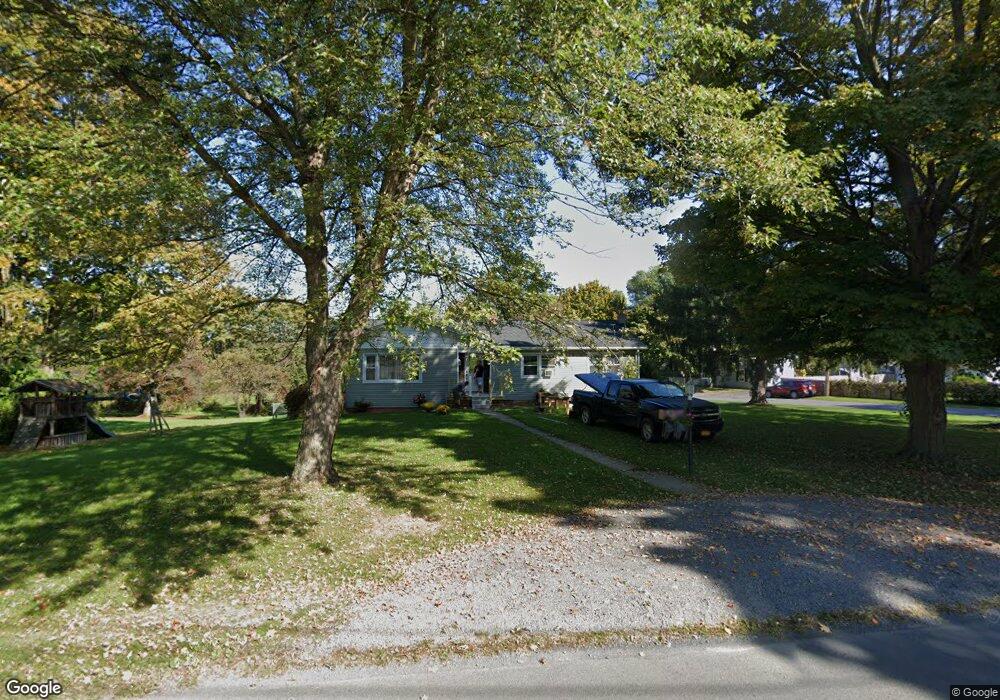
48 Maple Ave Port Byron, NY 13140
Estimated Value: $212,000 - $272,000
4
Beds
3
Baths
1,418
Sq Ft
$170/Sq Ft
Est. Value
About This Home
This home is located at 48 Maple Ave, Port Byron, NY 13140 and is currently estimated at $240,615, approximately $169 per square foot. 48 Maple Ave is a home located in Cayuga County with nearby schools including A.A. Gates Elementary School and Port Byron Senior High School.
Ownership History
Date
Name
Owned For
Owner Type
Purchase Details
Closed on
Feb 18, 2009
Sold by
Reh Matthew
Bought by
Brundage Joshue
Current Estimated Value
Home Financials for this Owner
Home Financials are based on the most recent Mortgage that was taken out on this home.
Original Mortgage
$112,720
Outstanding Balance
$71,100
Interest Rate
5.06%
Mortgage Type
FHA
Estimated Equity
$169,515
Purchase Details
Closed on
Feb 6, 2009
Sold by
Reh Matthew A and Reh Stephanie L
Bought by
Brundage Joshua and Kincaid Trista
Home Financials for this Owner
Home Financials are based on the most recent Mortgage that was taken out on this home.
Original Mortgage
$112,720
Outstanding Balance
$71,100
Interest Rate
5.06%
Mortgage Type
FHA
Estimated Equity
$169,515
Purchase Details
Closed on
Jun 29, 2000
Sold by
James Knapton
Bought by
Reh Matthew
Purchase Details
Closed on
Jul 13, 1995
Sold by
Applebee William Applebee Debo
Bought by
Knapton James E and Knapton Deborah P
Create a Home Valuation Report for This Property
The Home Valuation Report is an in-depth analysis detailing your home's value as well as a comparison with similar homes in the area
Home Values in the Area
Average Home Value in this Area
Purchase History
| Date | Buyer | Sale Price | Title Company |
|---|---|---|---|
| Brundage Joshue | $114,800 | Richard Spatari | |
| Brundage Joshua | $114,800 | None Available | |
| Reh Matthew | $89,900 | Howard Clark | |
| Knapton James E | $90,000 | -- |
Source: Public Records
Mortgage History
| Date | Status | Borrower | Loan Amount |
|---|---|---|---|
| Open | Brundage Joshua | $112,720 |
Source: Public Records
Tax History
| Year | Tax Paid | Tax Assessment Tax Assessment Total Assessment is a certain percentage of the fair market value that is determined by local assessors to be the total taxable value of land and additions on the property. | Land | Improvement |
|---|---|---|---|---|
| 2024 | $5,290 | $132,400 | $12,700 | $119,700 |
| 2023 | $5,432 | $132,400 | $12,700 | $119,700 |
| 2022 | $5,250 | $132,400 | $12,700 | $119,700 |
| 2021 | $5,293 | $130,400 | $12,700 | $117,700 |
| 2020 | $4,844 | $130,400 | $12,700 | $117,700 |
| 2019 | $1,194 | $130,400 | $12,700 | $117,700 |
| 2018 | $4,641 | $130,400 | $12,700 | $117,700 |
| 2017 | $4,646 | $130,400 | $12,700 | $117,700 |
| 2016 | $4,495 | $130,400 | $12,700 | $117,700 |
| 2015 | -- | $111,500 | $12,700 | $98,800 |
| 2014 | -- | $111,500 | $12,700 | $98,800 |
Source: Public Records
Map
Nearby Homes
- 21 Jetty Dr
- 179 Main St
- 0 State Route 31 Unit R1657517
- 9 E Dock St
- 5 Canal St
- 5 First Hill St
- 9246 Oakland Rd
- 8299 State Street Rd
- 8048 Lasher Rd
- 8052 Centerport Rd
- 8914 Jackson St
- 2732 Green St
- 2756 Green St
- 2799 Marshall St
- 2806 Marshall St
- 2809 Sharon St
- 1261 Stickles Ln
- 2917 Ryan Rd
- 1218 Hard Point Rd
- 8418 Shepherd Rd
Your Personal Tour Guide
Ask me questions while you tour the home.