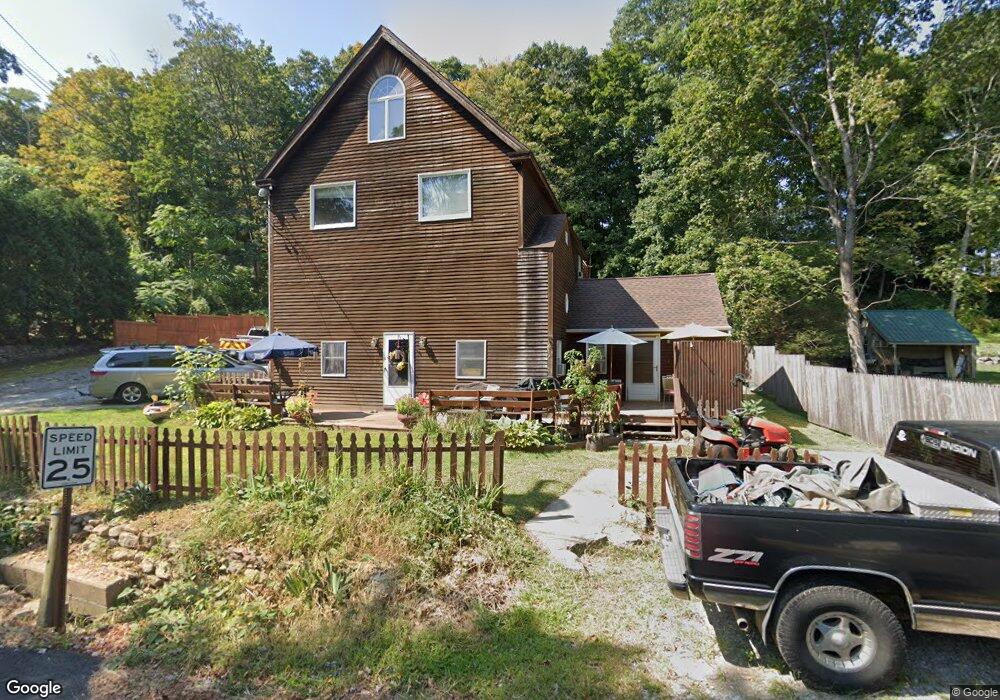
48 Maple St Chester, CT 06412
Estimated Value: $483,000 - $652,000
6
Beds
5
Baths
3,302
Sq Ft
$167/Sq Ft
Est. Value
About This Home
This home is located at 48 Maple St, Chester, CT 06412 and is currently estimated at $550,077, approximately $166 per square foot. 48 Maple St is a home located in Middlesex County with nearby schools including Valley Regional High School.
Ownership History
Date
Name
Owned For
Owner Type
Purchase Details
Closed on
Sep 18, 2014
Sold by
Clark Frank and Clark Lynn
Bought by
Becker Andrew N
Current Estimated Value
Home Financials for this Owner
Home Financials are based on the most recent Mortgage that was taken out on this home.
Original Mortgage
$250,203
Interest Rate
4.14%
Mortgage Type
FHA
Create a Home Valuation Report for This Property
The Home Valuation Report is an in-depth analysis detailing your home's value as well as a comparison with similar homes in the area
Home Values in the Area
Average Home Value in this Area
Purchase History
| Date | Buyer | Sale Price | Title Company |
|---|---|---|---|
| Becker Andrew N | $295,000 | -- | |
| Becker Andrew N | $295,000 | -- |
Source: Public Records
Mortgage History
| Date | Status | Borrower | Loan Amount |
|---|---|---|---|
| Open | Becker Andrew N | $50,000 | |
| Open | Becker Andrew N | $248,000 | |
| Closed | Becker Andrew N | $250,203 |
Source: Public Records
Tax History
| Year | Tax Paid | Tax Assessment Tax Assessment Total Assessment is a certain percentage of the fair market value that is determined by local assessors to be the total taxable value of land and additions on the property. | Land | Improvement |
|---|---|---|---|---|
| 2025 | $8,214 | $303,310 | $64,470 | $238,840 |
| 2024 | $7,416 | $303,310 | $64,470 | $238,840 |
| 2023 | $6,069 | $204,350 | $66,530 | $137,820 |
| 2022 | $6,028 | $204,350 | $66,530 | $137,820 |
| 2021 | $6,049 | $205,040 | $67,220 | $137,820 |
| 2020 | $5,868 | $205,040 | $67,220 | $137,820 |
| 2019 | $5,903 | $205,040 | $67,220 | $137,820 |
| 2018 | $6,864 | $253,200 | $70,950 | $182,250 |
| 2017 | $5,752 | $218,200 | $70,950 | $147,250 |
| 2016 | $4,399 | $218,200 | $70,950 | $147,250 |
| 2015 | $5,525 | $218,200 | $70,950 | $147,250 |
| 2014 | $5,416 | $218,200 | $70,950 | $147,250 |
Source: Public Records
Map
Nearby Homes
Your Personal Tour Guide
Ask me questions while you tour the home.