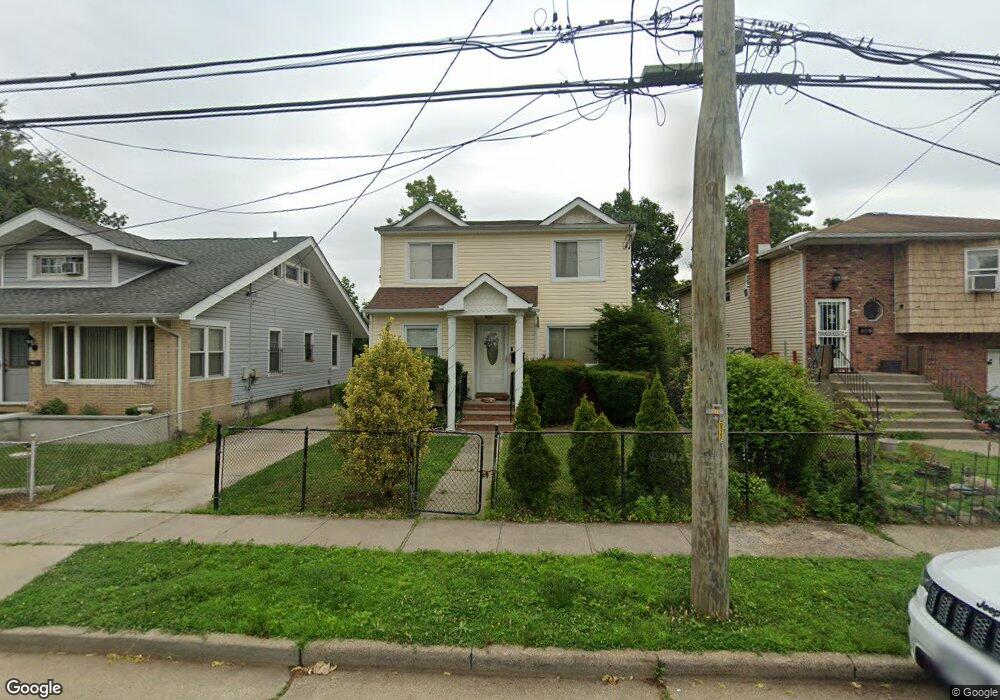
48 Maplewood Ave Hempstead, NY 11550
Estimated Value: $485,000 - $641,189
--
Bed
2
Baths
1,704
Sq Ft
$330/Sq Ft
Est. Value
About This Home
This home is located at 48 Maplewood Ave, Hempstead, NY 11550 and is currently estimated at $563,095, approximately $330 per square foot. 48 Maplewood Ave is a home located in Nassau County with nearby schools including Northern Parkway Elementary School, Lawrence Road Middle School, and Uniondale High School.
Ownership History
Date
Name
Owned For
Owner Type
Purchase Details
Closed on
Nov 5, 2010
Sold by
Us Bank National Association
Bought by
Europe Trevor and Wilkinson Eloise
Current Estimated Value
Home Financials for this Owner
Home Financials are based on the most recent Mortgage that was taken out on this home.
Original Mortgage
$241,430
Interest Rate
4.5%
Mortgage Type
FHA
Purchase Details
Closed on
Dec 8, 2008
Sold by
Referee Of Nassau County and Rockitter
Bought by
Countrywide Home Loans Inc
Purchase Details
Closed on
May 23, 2005
Sold by
Sebea Celor
Bought by
Exantus Mariano
Purchase Details
Closed on
Sep 23, 2003
Sold by
Sebea Celor
Purchase Details
Closed on
Jul 19, 2000
Sold by
Chin Dothlyn A
Bought by
Sebeg Celor
Create a Home Valuation Report for This Property
The Home Valuation Report is an in-depth analysis detailing your home's value as well as a comparison with similar homes in the area
Home Values in the Area
Average Home Value in this Area
Purchase History
| Date | Buyer | Sale Price | Title Company |
|---|---|---|---|
| Europe Trevor | $235,000 | -- | |
| Europe Trevor | $235,000 | -- | |
| Europe Trevor | $235,000 | -- | |
| Countrywide Home Loans Inc | $323,338 | Attoeney | |
| Countrywide Home Loans Inc | $323,338 | Attoeney | |
| Exantus Mariano | $355,000 | -- | |
| Exantus Mariano | $355,000 | -- | |
| -- | -- | -- | |
| -- | -- | -- | |
| Sebeg Celor | $185,000 | Tim Quinn | |
| Sebeg Celor | $185,000 | Tim Quinn |
Source: Public Records
Mortgage History
| Date | Status | Borrower | Loan Amount |
|---|---|---|---|
| Previous Owner | Europe Trevor | $241,430 | |
| Closed | Countrywide Home Loans Inc | $0 |
Source: Public Records
Tax History Compared to Growth
Tax History
| Year | Tax Paid | Tax Assessment Tax Assessment Total Assessment is a certain percentage of the fair market value that is determined by local assessors to be the total taxable value of land and additions on the property. | Land | Improvement |
|---|---|---|---|---|
| 2025 | $6,227 | $400 | $121 | $279 |
| 2024 | $1,010 | $400 | $121 | $279 |
| 2023 | $4,782 | $400 | $121 | $279 |
| 2022 | $4,782 | $400 | $121 | $279 |
| 2021 | $6,370 | $381 | $115 | $266 |
| 2020 | $4,153 | $415 | $408 | $7 |
| 2019 | $3,472 | $415 | $408 | $7 |
| 2018 | $3,261 | $415 | $0 | $0 |
| 2017 | $2,321 | $415 | $386 | $29 |
| 2016 | $3,047 | $439 | $308 | $131 |
| 2015 | $777 | $464 | $278 | $186 |
| 2014 | $777 | $464 | $278 | $186 |
| 2013 | $902 | $582 | $349 | $233 |
Source: Public Records
Map
Nearby Homes
- 66 Elmwood Ave
- 52 Elmwood Ave
- 33 Elmwood Ave
- 355 Jerusalem Ave
- 111 Jean Ave
- 403 Jerusalem Ave
- 139 Jean Ave
- 206 Belmont Pkwy
- 203 Rutland Rd
- 602 Leonard Ave
- 106 Spencer Place
- 159 Jean Ave
- 178 Rutland Rd
- 78 Spencer Place
- 110 Powell Place
- 183 Perry St
- 541 Bedford Ave
- 664 Clinton Ave
- 7 Stanley Place
- 244 Brown Ave
- 54 Maplewood Ave
- 42 Maplewood Ave
- 60 Maplewood Ave
- 85 Belmont Pkwy
- 89 Belmont Pkwy
- 81 Belmont Pkwy
- 36 Maplewood Ave
- 91 Belmont Pkwy
- 77 Belmont Pkwy
- 41 Maplewood Ave
- 64 Maplewood Ave
- 73 Belmont Pkwy
- 95 Belmont Pkwy
- 57 Maplewood Ave
- 30 Maplewood Ave
- 69 Belmont Pkwy
- 101 Belmont Pkwy
- 70 Maplewood Ave
- 63 Maplewood Ave
- 105 Belmont Pkwy