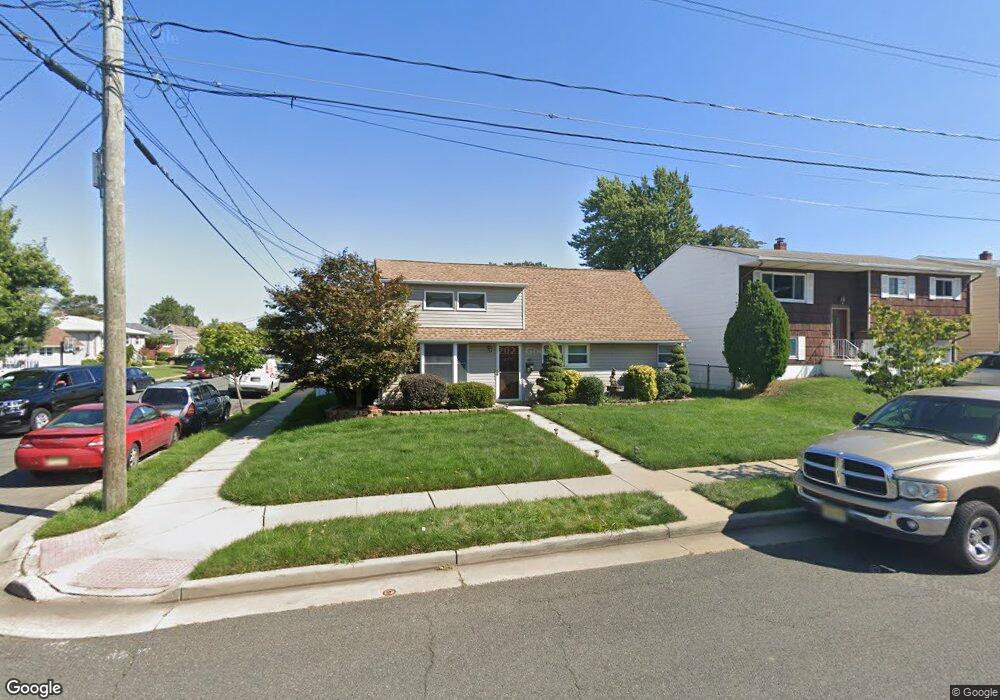
48 Marion St Port Reading, NJ 07064
Estimated Value: $488,624 - $655,000
6
Beds
2
Baths
2,816
Sq Ft
$211/Sq Ft
Est. Value
About This Home
This home is located at 48 Marion St, Port Reading, NJ 07064 and is currently estimated at $593,156, approximately $210 per square foot. 48 Marion St is a home located in Middlesex County with nearby schools including Port Reading Elementary School, Avenel Middle School, and Woodbridge High School.
Ownership History
Date
Name
Owned For
Owner Type
Purchase Details
Closed on
Dec 15, 2006
Current Estimated Value
Home Financials for this Owner
Home Financials are based on the most recent Mortgage that was taken out on this home.
Original Mortgage
$310,000
Outstanding Balance
$184,910
Interest Rate
6.36%
Estimated Equity
$408,246
Purchase Details
Closed on
Nov 20, 2006
Sold by
Simeone Donna
Bought by
King Whitson and King Jose
Home Financials for this Owner
Home Financials are based on the most recent Mortgage that was taken out on this home.
Original Mortgage
$310,000
Outstanding Balance
$184,910
Interest Rate
6.36%
Estimated Equity
$408,246
Create a Home Valuation Report for This Property
The Home Valuation Report is an in-depth analysis detailing your home's value as well as a comparison with similar homes in the area
Home Values in the Area
Average Home Value in this Area
Purchase History
| Date | Buyer | Sale Price | Title Company |
|---|---|---|---|
| -- | -- | -- | |
| King Whitson | $310,000 | -- |
Source: Public Records
Mortgage History
| Date | Status | Borrower | Loan Amount |
|---|---|---|---|
| Open | King Whitson | $310,000 |
Source: Public Records
Tax History
| Year | Tax Paid | Tax Assessment Tax Assessment Total Assessment is a certain percentage of the fair market value that is determined by local assessors to be the total taxable value of land and additions on the property. | Land | Improvement |
|---|---|---|---|---|
| 2025 | $10,379 | $77,900 | $18,000 | $59,900 |
| 2024 | $10,076 | $77,900 | $18,000 | $59,900 |
Source: Public Records
Map
Nearby Homes
Your Personal Tour Guide
Ask me questions while you tour the home.