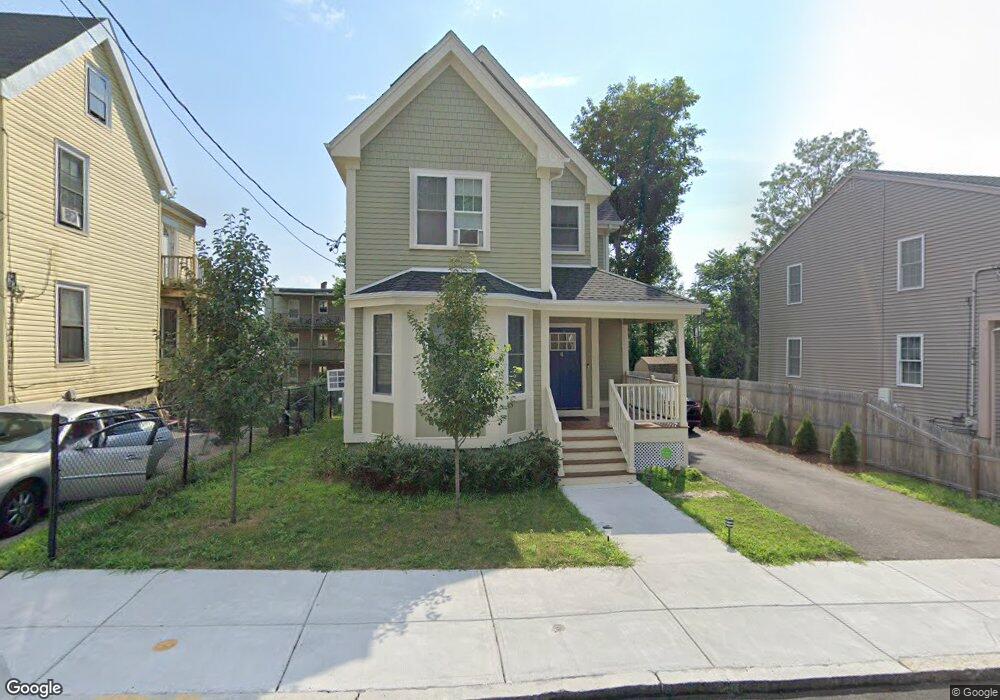
48 Mattapan St Boston, MA 02126
Wellington Hill NeighborhoodEstimated Value: $576,000 - $880,000
3
Beds
3
Baths
1,790
Sq Ft
$396/Sq Ft
Est. Value
About This Home
This home is located at 48 Mattapan St, Boston, MA 02126 and is currently estimated at $708,965, approximately $396 per square foot. 48 Mattapan St is a home located in Suffolk County with nearby schools including KIPP Academy Boston Charter School and Berea Seventh-day Adventist Academy.
Ownership History
Date
Name
Owned For
Owner Type
Purchase Details
Closed on
Apr 30, 2024
Sold by
Jackson Lorenza and Jackson Lokita R
Bought by
Omolade Damali
Current Estimated Value
Home Financials for this Owner
Home Financials are based on the most recent Mortgage that was taken out on this home.
Original Mortgage
$677,000
Outstanding Balance
$666,238
Interest Rate
6.87%
Mortgage Type
Purchase Money Mortgage
Estimated Equity
$42,727
Purchase Details
Closed on
Dec 24, 2007
Sold by
Larosa Dev Corp
Bought by
Jackson Lokita R and Jackson Lorenza
Home Financials for this Owner
Home Financials are based on the most recent Mortgage that was taken out on this home.
Original Mortgage
$314,265
Interest Rate
6.3%
Mortgage Type
Purchase Money Mortgage
Create a Home Valuation Report for This Property
The Home Valuation Report is an in-depth analysis detailing your home's value as well as a comparison with similar homes in the area
Home Values in the Area
Average Home Value in this Area
Purchase History
| Date | Buyer | Sale Price | Title Company |
|---|---|---|---|
| Omolade Damali | $735,000 | None Available | |
| Omolade Damali | $735,000 | None Available | |
| Jackson Lokita R | $324,500 | -- | |
| Jackson Lokita R | $324,500 | -- |
Source: Public Records
Mortgage History
| Date | Status | Borrower | Loan Amount |
|---|---|---|---|
| Open | Omolade Damali | $677,000 | |
| Closed | Omolade Damali | $677,000 | |
| Previous Owner | Jackson Lokita R | $314,265 |
Source: Public Records
Tax History Compared to Growth
Tax History
| Year | Tax Paid | Tax Assessment Tax Assessment Total Assessment is a certain percentage of the fair market value that is determined by local assessors to be the total taxable value of land and additions on the property. | Land | Improvement |
|---|---|---|---|---|
| 2025 | $6,022 | $520,000 | $0 | $520,000 |
| 2024 | $4,585 | $420,600 | $0 | $420,600 |
| 2023 | $4,382 | $408,000 | $0 | $408,000 |
| 2022 | $4,150 | $381,400 | $0 | $381,400 |
| 2021 | $3,839 | $359,800 | $0 | $359,800 |
| 2020 | $3,763 | $356,300 | $0 | $356,300 |
| 2019 | $3,414 | $323,900 | $0 | $323,900 |
| 2018 | $3,394 | $323,900 | $0 | $323,900 |
| 2017 | $3,235 | $305,500 | $0 | $305,500 |
| 2016 | $3,263 | $296,600 | $0 | $296,600 |
| 2015 | $3,384 | $279,400 | $0 | $279,400 |
| 2014 | -- | $271,100 | $0 | $271,100 |
Source: Public Records
Map
Nearby Homes
- 49 Fottler Rd
- 10 Itasca St
- 45 1st Ave Unit 111
- 710 Walk Hill St
- 116 Almont St
- 12 Hiawatha Rd
- 23 Fessenden St
- 25 Fessenden St
- 60 and 64 Monterey Ave
- 20 Monterey Ave
- 567B Norfolk St
- 100 Itasca St
- 14-14R Kennebec St
- 1465 Blue Hill Ave
- 4 Gilmer St
- 10 Hosmer St
- 157 Delhi St
- 11 French St
- 4 Crossman St Unit 4
- 32 Violet St
- 48 Mattapan St
- 48 Mattapan St
- 48 Mattapan St
- 48 Mattapan St
- 48 Mattapan St
- 48 Mattapan St
- 48 Mattapan St
- 48 Mattapan St
- 48 Mattapan St
- 46 Mattapan St
- 46 Mattapan St
- 52 Mattapan St
- 52 Mattapan St
- 52 Mattapan St
- 52 Mattapan St
- 52 Mattapan St
- 52 Mattapan St Unit 54
- 52 Mattapan St
- 52 Mattapan St
- 52 Mattapan St Unit 2