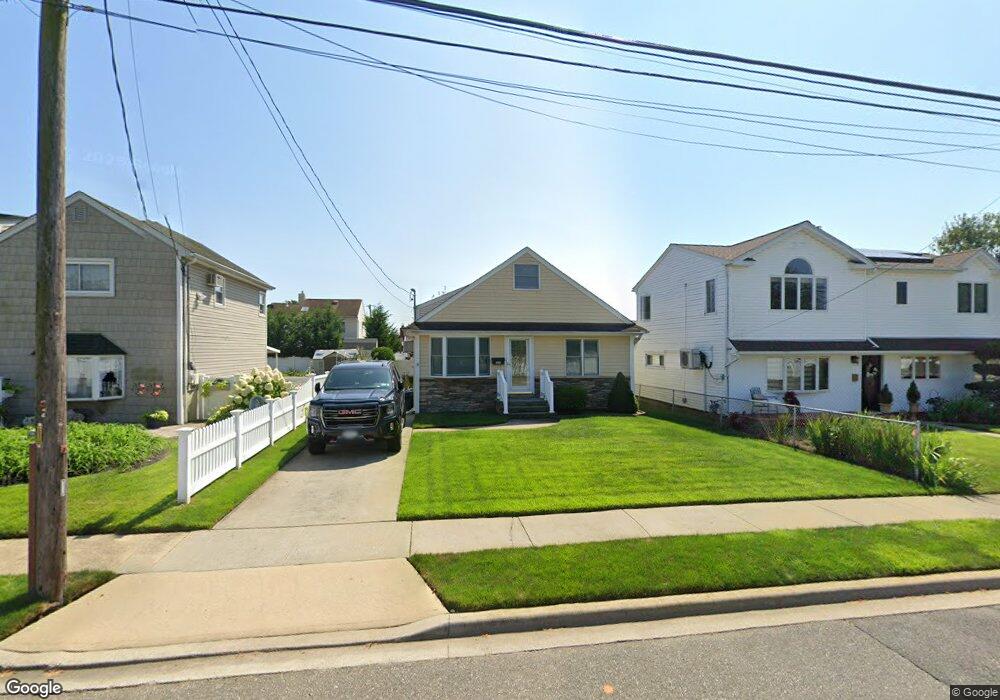
48 Mckinley Place Unit A Massapequa, NY 11758
Estimated Value: $615,749 - $763,000
--
Bed
2
Baths
1,050
Sq Ft
$657/Sq Ft
Est. Value
About This Home
This home is located at 48 Mckinley Place Unit A, Massapequa, NY 11758 and is currently estimated at $689,375, approximately $656 per square foot. 48 Mckinley Place Unit A is a home located in Nassau County with nearby schools including Massapequa High School - Ames Campus, Berner Middle School, and Massapequa High School.
Ownership History
Date
Name
Owned For
Owner Type
Purchase Details
Closed on
May 23, 2022
Sold by
Bohenek Jo Ann and Bohenek John J
Bought by
Bohenek John J and Bohenek Jo Ann
Current Estimated Value
Purchase Details
Closed on
Sep 21, 2009
Sold by
Bohenek Dorothy
Bought by
Bohenek Jo Ann and Bohenek John J
Create a Home Valuation Report for This Property
The Home Valuation Report is an in-depth analysis detailing your home's value as well as a comparison with similar homes in the area
Home Values in the Area
Average Home Value in this Area
Purchase History
| Date | Buyer | Sale Price | Title Company |
|---|---|---|---|
| Bohenek John J | -- | None Available | |
| Bohenek Jo Ann | -- | -- |
Source: Public Records
Tax History Compared to Growth
Tax History
| Year | Tax Paid | Tax Assessment Tax Assessment Total Assessment is a certain percentage of the fair market value that is determined by local assessors to be the total taxable value of land and additions on the property. | Land | Improvement |
|---|---|---|---|---|
| 2025 | $13,192 | $463 | $171 | $292 |
| 2024 | $3,941 | $463 | $171 | $292 |
| 2023 | $12,211 | $463 | $171 | $292 |
| 2022 | $12,211 | $463 | $171 | $292 |
| 2021 | $11,044 | $439 | $162 | $277 |
| 2020 | $10,503 | $593 | $586 | $7 |
| 2019 | $3,409 | $635 | $588 | $47 |
| 2018 | $7,044 | $677 | $0 | $0 |
| 2017 | $6,987 | $720 | $515 | $205 |
| 2016 | $10,489 | $876 | $627 | $249 |
| 2015 | $3,825 | $876 | $627 | $249 |
| 2014 | $3,825 | $876 | $627 | $249 |
| 2013 | $3,478 | $876 | $627 | $249 |
Source: Public Records
Map
Nearby Homes
- 243 Seaford Ave
- 230 W End Ave
- 3937 John Ln
- 138 Saint Marks Place
- 344 Harrison Ave
- 3875 South St
- 135 Ocean Ave
- 65 Jefferson Place
- 2437 Archer St
- 2327 Mattituck Ave
- 94 Alhambra Rd
- 33 W End Ave
- 5675 Merrick Rd
- 3945 Hickory St
- 5 Canal Rd
- 4 Sutton Place
- 3969 Marlow Ct
- 94 Forest Ave
- 17 Linden St
- 80 Ocean Ave
- 48 Mckinley Place
- 50 Mckinley Place
- 53 Cleveland Place
- 46 Mckinley Place
- 55 Cleveland Place
- 51 Cleveland Place
- 260 Forest Ave
- 256 Forest Ave
- 47 Cleveland Place
- 258 Forest Ave
- 263 Haight Ave
- 45 Mckinley Place
- 254 Forest Ave
- 44 Mckinley Place
- 45 Cleveland Place
- 262 Forest Ave
- 41 Cleveland Place
- 267 Haight Ave
- 54 Cleveland Place
- 50 Cleveland Place