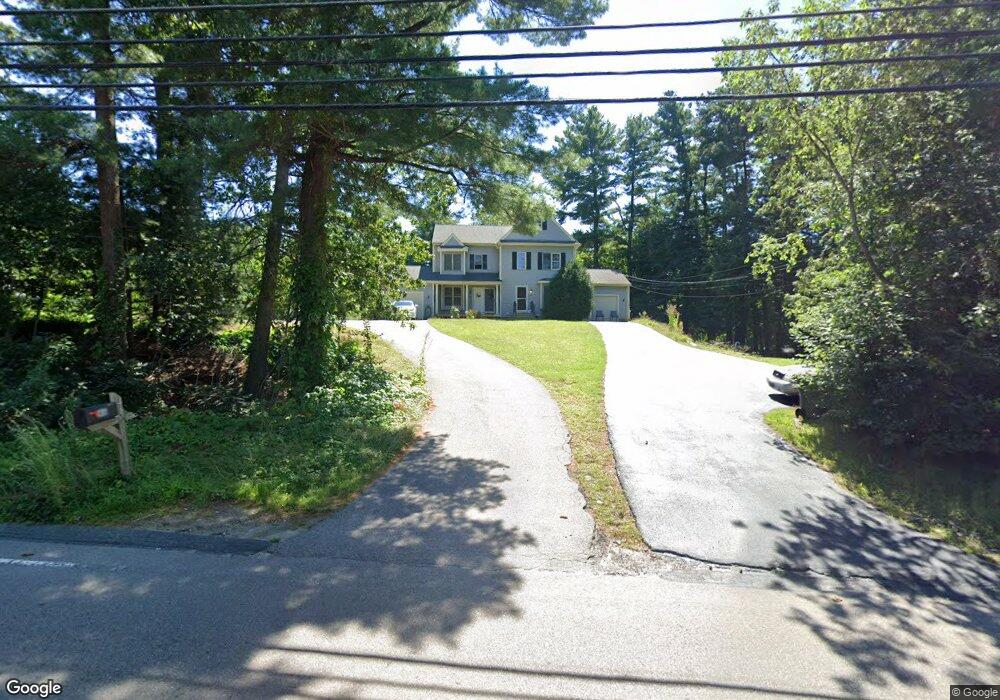
48 Mendon St Bellingham, MA 02019
Estimated Value: $449,000 - $502,000
2
Beds
2
Baths
1,440
Sq Ft
$323/Sq Ft
Est. Value
About This Home
This home is located at 48 Mendon St, Bellingham, MA 02019 and is currently estimated at $465,535, approximately $323 per square foot. 48 Mendon St is a home located in Norfolk County with nearby schools including Stall Brook Elementary School, Bellingham High School, and Bethany Christian Academy.
Ownership History
Date
Name
Owned For
Owner Type
Purchase Details
Closed on
Jan 23, 2025
Sold by
Manickam Subash
Bought by
Manickam Ft and Manickam
Current Estimated Value
Purchase Details
Closed on
May 15, 2013
Sold by
Ellen Rt and Rosenfeld
Bought by
Rasavong Lute
Home Financials for this Owner
Home Financials are based on the most recent Mortgage that was taken out on this home.
Original Mortgage
$228,000
Interest Rate
3.57%
Mortgage Type
New Conventional
Purchase Details
Closed on
May 16, 2005
Sold by
Lallier Gilcya
Bought by
Manickam Subash
Purchase Details
Closed on
Jan 30, 2004
Sold by
Sirva Relocation Llc
Bought by
Lallier Gilcya
Create a Home Valuation Report for This Property
The Home Valuation Report is an in-depth analysis detailing your home's value as well as a comparison with similar homes in the area
Home Values in the Area
Average Home Value in this Area
Purchase History
| Date | Buyer | Sale Price | Title Company |
|---|---|---|---|
| Manickam Ft | -- | None Available | |
| Manickam Ft | -- | None Available | |
| Rasavong Lute | -- | -- | |
| Rasavong Lute | -- | -- | |
| Rasavong Lute | -- | -- | |
| Manickam Subash | $320,000 | -- | |
| Manickam Subash | $320,000 | -- | |
| Lallier Gilcya | $289,000 | -- | |
| Sirva Relocation Llc | $289,000 | -- | |
| Sirva Relocation Llc | $289,000 | -- |
Source: Public Records
Mortgage History
| Date | Status | Borrower | Loan Amount |
|---|---|---|---|
| Previous Owner | Rasavong Lute | $228,000 | |
| Previous Owner | Sirva Relocation Llc | $241,500 |
Source: Public Records
Tax History
| Year | Tax Paid | Tax Assessment Tax Assessment Total Assessment is a certain percentage of the fair market value that is determined by local assessors to be the total taxable value of land and additions on the property. | Land | Improvement |
|---|---|---|---|---|
| 2025 | $5,279 | $420,300 | $0 | $420,300 |
| 2024 | $5,257 | $408,800 | $0 | $408,800 |
| 2023 | $4,617 | $353,800 | $0 | $353,800 |
| 2022 | $4,527 | $321,500 | $0 | $321,500 |
| 2021 | $4,574 | $317,400 | $0 | $317,400 |
| 2020 | $4,270 | $300,300 | $0 | $300,300 |
| 2019 | $3,918 | $275,700 | $0 | $275,700 |
| 2018 | $3,956 | $274,500 | $0 | $274,500 |
| 2017 | $3,806 | $265,400 | $0 | $265,400 |
| 2016 | $3,494 | $244,500 | $0 | $244,500 |
| 2015 | $3,484 | $244,500 | $0 | $244,500 |
| 2014 | $3,603 | $245,800 | $0 | $245,800 |
Source: Public Records
Map
Nearby Homes
- 23 Bellwood Cir Unit 23
- 31 Bellwood Cir Unit 31B
- 1 Evergreen Dr Unit 1
- 123-125 Mendon St
- 7 Palmetto Dr Unit 7
- 7 Debra Ln Unit 1
- 125 Blackstone St
- 67 Blackstone St
- 1 Whitman Cir Unit 1
- 3 Whitman Cir Unit 3
- 5 Whitman Cir Unit 5
- 6 Barrows Rd
- 3003 Maple Brook Rd Unit 3003
- 48 Donna Rd
- 95 Lisa Ann Dr
- 1501 Old Bridge Ln Unit 1501
- 640 Maple Brook Rd
- 60 Wethersfield Rd
- 67 Jeannine Rd
- 0 Hartford Ave
- 48 Mendon Rd Unit 48
- 46 Mendon St
- 42 Mendon St
- 40 Mendon St
- 40 Mendon St Unit 40
- 42 Mendon St Unit 58
- 42 Mendon St Unit 42
- 36 Mendon St
- 58 Mendon St
- 56 Mendon St
- 49 Mendon St
- 24 Bellwood Cir
- 23 Bellwood Cir
- 22 Bellwood Cir
- 21 Bellwood Cir
- 20 Bellwood Cir
- 19 Bellwood Cir
- 21 Bellwood Cir Unit 21
- 23 Bellwood Cir Unit 23,0
- 3 Northeast Dr
Your Personal Tour Guide
Ask me questions while you tour the home.