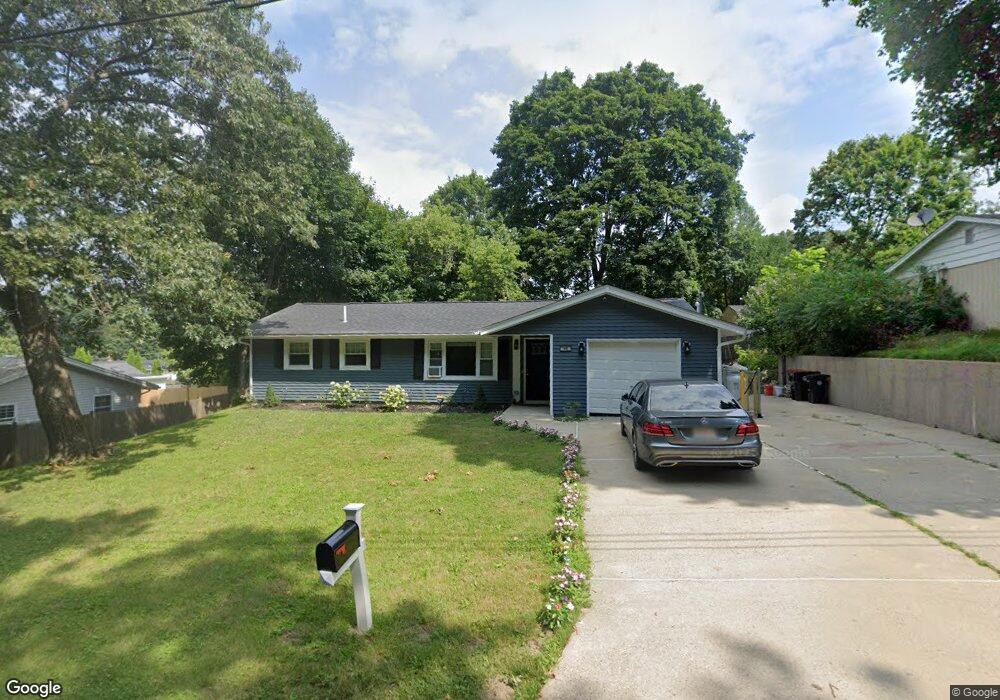
48 Mildred Rd Unit 1 Brockton, MA 02302
Estimated Value: $407,000 - $516,000
3
Beds
1
Bath
1,116
Sq Ft
$430/Sq Ft
Est. Value
About This Home
This home is located at 48 Mildred Rd Unit 1, Brockton, MA 02302 and is currently estimated at $480,227, approximately $430 per square foot. 48 Mildred Rd Unit 1 is a home located in Plymouth County with nearby schools including Brookfield Elementary School, Downey Elementary School, and Ashfield Middle School.
Ownership History
Date
Name
Owned For
Owner Type
Purchase Details
Closed on
Jul 20, 2017
Sold by
Keller John F and Us Bank Na
Bought by
Randolph Rei Group Llc
Current Estimated Value
Home Financials for this Owner
Home Financials are based on the most recent Mortgage that was taken out on this home.
Original Mortgage
$171,500
Outstanding Balance
$141,794
Interest Rate
3.89%
Mortgage Type
New Conventional
Estimated Equity
$338,433
Purchase Details
Closed on
Jun 24, 1994
Sold by
Ryan Christopher G and Ryan Theresa M
Bought by
Keller Louis and Keller Dorothy
Purchase Details
Closed on
Jun 1, 1989
Sold by
Copponi Pamela G
Bought by
Ryan Christopher G
Create a Home Valuation Report for This Property
The Home Valuation Report is an in-depth analysis detailing your home's value as well as a comparison with similar homes in the area
Home Values in the Area
Average Home Value in this Area
Purchase History
| Date | Buyer | Sale Price | Title Company |
|---|---|---|---|
| Randolph Rei Group Llc | $139,000 | -- | |
| Randolph Rei Group Llc | $139,000 | -- | |
| Keller Louis | $79,900 | -- | |
| Ryan Christopher G | $125,000 | -- |
Source: Public Records
Mortgage History
| Date | Status | Borrower | Loan Amount |
|---|---|---|---|
| Open | Randolph Rei Group Llc | $171,500 | |
| Closed | Ryan Christopher G | $171,500 | |
| Previous Owner | Ryan Christopher G | $18,200 |
Source: Public Records
Tax History Compared to Growth
Tax History
| Year | Tax Paid | Tax Assessment Tax Assessment Total Assessment is a certain percentage of the fair market value that is determined by local assessors to be the total taxable value of land and additions on the property. | Land | Improvement |
|---|---|---|---|---|
| 2025 | $3,633 | $300,000 | $144,400 | $155,600 |
| 2024 | $3,330 | $277,000 | $144,400 | $132,600 |
| 2023 | $2,467 | $190,100 | $109,200 | $80,900 |
| 2022 | $2,073 | $148,400 | $99,200 | $49,200 |
| 2021 | $4,006 | $276,300 | $92,700 | $183,600 |
| 2020 | $3,842 | $253,600 | $89,000 | $164,600 |
| 2019 | $3,834 | $246,700 | $82,800 | $163,900 |
| 2018 | $3,455 | $215,100 | $82,800 | $132,300 |
| 2017 | $3,009 | $186,900 | $82,800 | $104,100 |
| 2016 | $2,981 | $171,700 | $79,000 | $92,700 |
| 2015 | $2,770 | $152,600 | $79,000 | $73,600 |
| 2014 | $2,801 | $154,500 | $79,000 | $75,500 |
Source: Public Records
Map
Nearby Homes