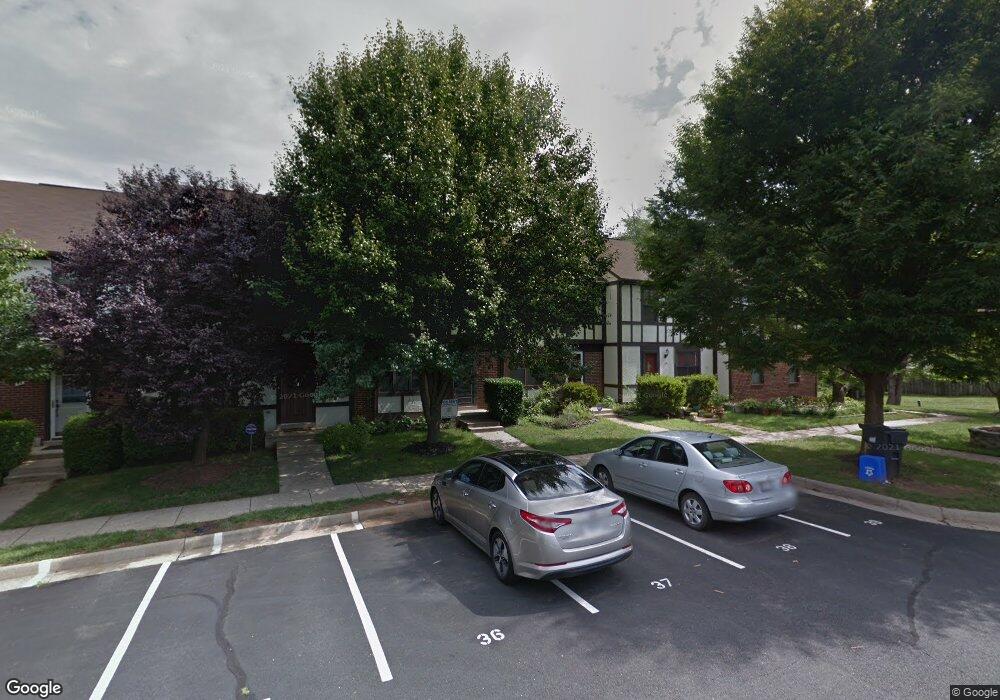
48 Millard Ct Sterling, VA 20165
Estimated Value: $511,281 - $535,000
3
Beds
3
Baths
1,327
Sq Ft
$395/Sq Ft
Est. Value
About This Home
This home is located at 48 Millard Ct, Sterling, VA 20165 and is currently estimated at $524,820, approximately $395 per square foot. 48 Millard Ct is a home located in Loudoun County with nearby schools including Algonkian Elementary School, River Bend Middle School, and Potomac Falls High School.
Ownership History
Date
Name
Owned For
Owner Type
Purchase Details
Closed on
Mar 18, 2005
Sold by
Powers James
Bought by
Austin David B
Current Estimated Value
Home Financials for this Owner
Home Financials are based on the most recent Mortgage that was taken out on this home.
Original Mortgage
$276,000
Outstanding Balance
$140,203
Interest Rate
5.64%
Mortgage Type
New Conventional
Estimated Equity
$384,617
Purchase Details
Closed on
Jan 24, 2003
Sold by
Garrett Richard
Bought by
Powers James
Home Financials for this Owner
Home Financials are based on the most recent Mortgage that was taken out on this home.
Original Mortgage
$205,810
Interest Rate
6.11%
Mortgage Type
New Conventional
Purchase Details
Closed on
Nov 16, 2000
Sold by
Pan Gilbert
Bought by
Silverman Harlan
Home Financials for this Owner
Home Financials are based on the most recent Mortgage that was taken out on this home.
Original Mortgage
$156,820
Interest Rate
7.78%
Purchase Details
Closed on
Feb 14, 2000
Sold by
Croteau Arthur E
Bought by
Garrett Richard
Home Financials for this Owner
Home Financials are based on the most recent Mortgage that was taken out on this home.
Original Mortgage
$138,750
Interest Rate
8.11%
Create a Home Valuation Report for This Property
The Home Valuation Report is an in-depth analysis detailing your home's value as well as a comparison with similar homes in the area
Home Values in the Area
Average Home Value in this Area
Purchase History
| Date | Buyer | Sale Price | Title Company |
|---|---|---|---|
| Austin David B | $345,000 | -- | |
| Powers James | $207,000 | -- | |
| Silverman Harlan | $156,900 | -- | |
| Garrett Richard | $139,900 | -- |
Source: Public Records
Mortgage History
| Date | Status | Borrower | Loan Amount |
|---|---|---|---|
| Open | Austin David B | $276,000 | |
| Previous Owner | Powers James | $205,810 | |
| Previous Owner | Silverman Harlan | $156,820 | |
| Previous Owner | Garrett Richard | $138,750 |
Source: Public Records
Tax History Compared to Growth
Tax History
| Year | Tax Paid | Tax Assessment Tax Assessment Total Assessment is a certain percentage of the fair market value that is determined by local assessors to be the total taxable value of land and additions on the property. | Land | Improvement |
|---|---|---|---|---|
| 2025 | $3,884 | $482,450 | $145,000 | $337,450 |
| 2024 | $3,978 | $459,850 | $145,000 | $314,850 |
| 2023 | $3,878 | $443,200 | $145,000 | $298,200 |
| 2022 | $3,697 | $415,380 | $120,000 | $295,380 |
| 2021 | $3,602 | $367,510 | $105,000 | $262,510 |
| 2020 | $3,560 | $343,950 | $100,000 | $243,950 |
| 2019 | $3,307 | $316,440 | $100,000 | $216,440 |
| 2018 | $3,289 | $303,090 | $100,000 | $203,090 |
| 2017 | $3,246 | $288,570 | $100,000 | $188,570 |
| 2016 | $3,267 | $285,290 | $0 | $0 |
| 2015 | $3,188 | $180,870 | $0 | $180,870 |
| 2014 | $3,157 | $173,290 | $0 | $173,290 |
Source: Public Records
Map
Nearby Homes
- 21 Haxall Ct
- 21 Lipscomb Ct
- 48 Mcpherson Cir
- 9 Dorrell Ct
- 37 Alden Ct
- 3 Palmer Ct
- 15 Marian Ct
- 34 Palmer Ct
- 30 Quincy Ct
- 57 Bickel Ct
- 20150 Dairy Ln
- 9 Conoy Ct
- 45545 Lakeside Dr
- 20627 Cutwater Place
- 20173 Broad Run Dr
- 46225 Allsbrook Place
- 20941 Bluebird Square
- 45928 Swallow Terrace
- 45922 Swallow Terrace
- 46526 Cedarhurst Dr