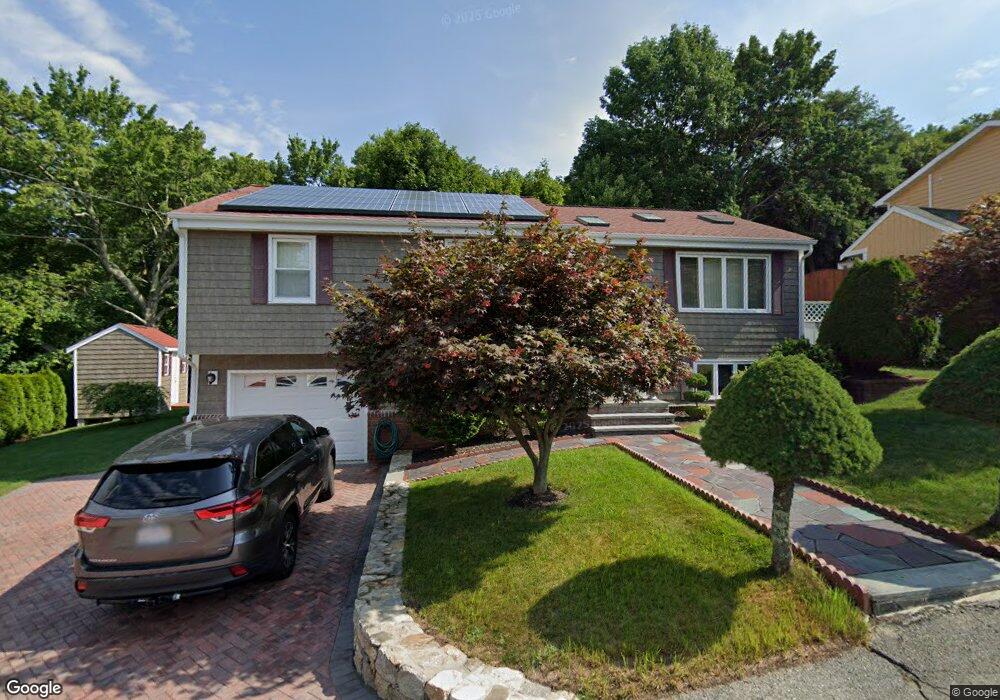
48 Millard St Fall River, MA 02720
Western Fall River NeighborhoodEstimated Value: $469,890 - $531,000
3
Beds
2
Baths
1,872
Sq Ft
$264/Sq Ft
Est. Value
About This Home
This home is located at 48 Millard St, Fall River, MA 02720 and is currently estimated at $493,723, approximately $263 per square foot. 48 Millard St is a home located in Bristol County with nearby schools including North End Elementary School, Morton Middle School, and B M C Durfee High School.
Ownership History
Date
Name
Owned For
Owner Type
Purchase Details
Closed on
Jul 28, 2023
Sold by
Braga Alvaro M and Braga Natalia
Bought by
Braga Irt and Braga
Current Estimated Value
Purchase Details
Closed on
Aug 30, 1991
Sold by
Robar Paul S and Robar Lorraine M
Bought by
Brago Alvaro M and Brago Maria N
Create a Home Valuation Report for This Property
The Home Valuation Report is an in-depth analysis detailing your home's value as well as a comparison with similar homes in the area
Home Values in the Area
Average Home Value in this Area
Purchase History
| Date | Buyer | Sale Price | Title Company |
|---|---|---|---|
| Braga Irt | -- | None Available | |
| Brago Alvaro M | $130,000 | -- |
Source: Public Records
Mortgage History
| Date | Status | Borrower | Loan Amount |
|---|---|---|---|
| Previous Owner | Brago Alvaro M | $120,000 | |
| Previous Owner | Brago Alvaro M | $37,958 | |
| Previous Owner | Brago Alvaro M | $122,000 |
Source: Public Records
Tax History
| Year | Tax Paid | Tax Assessment Tax Assessment Total Assessment is a certain percentage of the fair market value that is determined by local assessors to be the total taxable value of land and additions on the property. | Land | Improvement |
|---|---|---|---|---|
| 2025 | $3,898 | $340,400 | $116,400 | $224,000 |
| 2024 | $3,521 | $306,400 | $114,200 | $192,200 |
| 2023 | $3,561 | $290,200 | $102,800 | $187,400 |
| 2022 | $3,150 | $249,600 | $97,000 | $152,600 |
| 2021 | $3,109 | $224,800 | $92,700 | $132,100 |
| 2020 | $3,032 | $209,800 | $88,500 | $121,300 |
| 2019 | $3,117 | $213,800 | $92,500 | $121,300 |
| 2018 | $3,091 | $211,400 | $93,100 | $118,300 |
| 2017 | $2,946 | $210,400 | $93,100 | $117,300 |
| 2016 | $2,831 | $207,700 | $96,000 | $111,700 |
| 2015 | $2,647 | $202,400 | $96,000 | $106,400 |
| 2014 | $2,546 | $202,400 | $96,000 | $106,400 |
Source: Public Records
Map
Nearby Homes
- 3636 N Main St Unit 5
- 3682 N Main St Unit 6
- 4234 N Main St Unit 103
- 2714 Riverside Ave
- 72 Ida Ln
- 2106 Meridian St
- 54 Grant Ave
- 22 Apple Creek Ln
- 33 Warner St
- 210 Harrison Ave
- Parcel 2 Highcrest Rd
- 174 Columbus Dr
- 232 Mount Pleasant St
- 257 Calvin St
- 1810 Highland Ave Unit 22
- 46 Lilac Ave
- 318 Crescent St Unit A
- 29 Valentine St
- 1553 Riverside Ave
- 274 Archer St
Your Personal Tour Guide
Ask me questions while you tour the home.