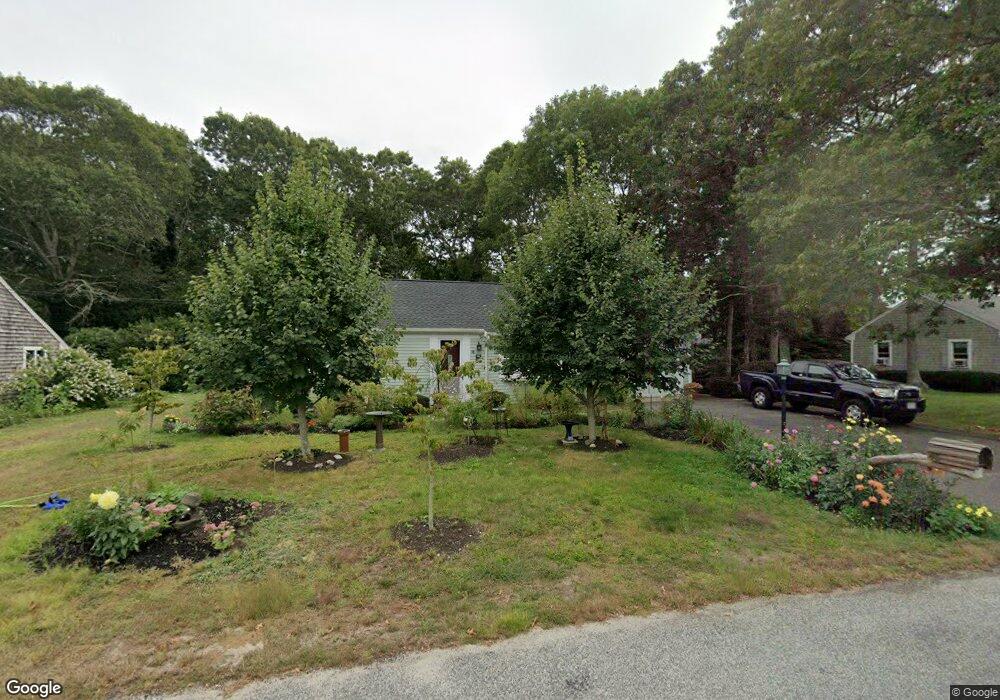
48 Monroe Ln Unit 1 West Yarmouth, MA 02673
South Yarmouth NeighborhoodEstimated Value: $439,000 - $495,701
2
Beds
1
Bath
912
Sq Ft
$524/Sq Ft
Est. Value
About This Home
This home is located at 48 Monroe Ln Unit 1, West Yarmouth, MA 02673 and is currently estimated at $477,675, approximately $523 per square foot. 48 Monroe Ln Unit 1 is a home located in Barnstable County with nearby schools including Dennis-Yarmouth Regional High School, Sturgis Charter Public School, and St. Pius X. School.
Ownership History
Date
Name
Owned For
Owner Type
Purchase Details
Closed on
Apr 7, 2016
Sold by
Samataro Paul F and Roberts Wanda B
Bought by
Johnson Jeffrey B and Johnson Catherine R
Current Estimated Value
Home Financials for this Owner
Home Financials are based on the most recent Mortgage that was taken out on this home.
Original Mortgage
$137,000
Outstanding Balance
$106,346
Interest Rate
3%
Mortgage Type
New Conventional
Estimated Equity
$371,329
Purchase Details
Closed on
Sep 5, 2013
Sold by
Roberts Wanda B
Bought by
Roberts Wanda B and Samataro Paul F
Purchase Details
Closed on
Apr 16, 2013
Sold by
Bennett Susan A
Bought by
Roberts Wanda B
Home Financials for this Owner
Home Financials are based on the most recent Mortgage that was taken out on this home.
Original Mortgage
$232,000
Interest Rate
3.55%
Mortgage Type
New Conventional
Create a Home Valuation Report for This Property
The Home Valuation Report is an in-depth analysis detailing your home's value as well as a comparison with similar homes in the area
Home Values in the Area
Average Home Value in this Area
Purchase History
| Date | Buyer | Sale Price | Title Company |
|---|---|---|---|
| Johnson Jeffrey B | $244,000 | -- | |
| Roberts Wanda B | -- | -- | |
| Roberts Wanda B | $232,000 | -- |
Source: Public Records
Mortgage History
| Date | Status | Borrower | Loan Amount |
|---|---|---|---|
| Open | Johnson Jeffrey B | $137,000 | |
| Previous Owner | Roberts Wanda B | $232,000 |
Source: Public Records
Tax History Compared to Growth
Tax History
| Year | Tax Paid | Tax Assessment Tax Assessment Total Assessment is a certain percentage of the fair market value that is determined by local assessors to be the total taxable value of land and additions on the property. | Land | Improvement |
|---|---|---|---|---|
| 2025 | $3,006 | $424,600 | $150,600 | $274,000 |
| 2024 | $2,877 | $389,800 | $138,300 | $251,500 |
| 2023 | $2,846 | $350,900 | $128,300 | $222,600 |
| 2022 | $2,726 | $296,900 | $120,200 | $176,700 |
| 2021 | $2,523 | $263,900 | $120,200 | $143,700 |
| 2020 | $2,481 | $248,100 | $120,100 | $128,000 |
| 2019 | $2,314 | $229,100 | $120,100 | $109,000 |
| 2018 | $2,174 | $211,300 | $102,300 | $109,000 |
| 2017 | $2,134 | $213,000 | $97,900 | $115,100 |
| 2016 | $2,037 | $204,100 | $89,000 | $115,100 |
| 2015 | $2,085 | $207,700 | $89,000 | $118,700 |
Source: Public Records
Map
Nearby Homes
- 18 Captain Stanley Rd
- 24 Fast Brook Rd
- 48 Captain Dore Rd
- 35 Captain Percival Rd
- 11 Bob-O-link Ln
- 49 Captain Besse Rd
- 33 Lake Rd
- 23 Circuit Rd N
- 68 Bob-O-link Ln
- 72 Quartermaster Row
- 147 Captain Bacon Rd
- 3 Saturn Ln
- 2 Ocean Spray Ln
- 62 Danas Path
- 17 Trowbridge Path
- 560 W Yarmouth Rd
- 33 Sparrow Way
- 21 Hazelmoor Rd
- 607 W Yarmouth Rd
- 844 Route 28 Unit 2A