48 N Allen Dr Lodi, CA 95242
Sunwest NeighborhoodEstimated Value: $447,000 - $494,000
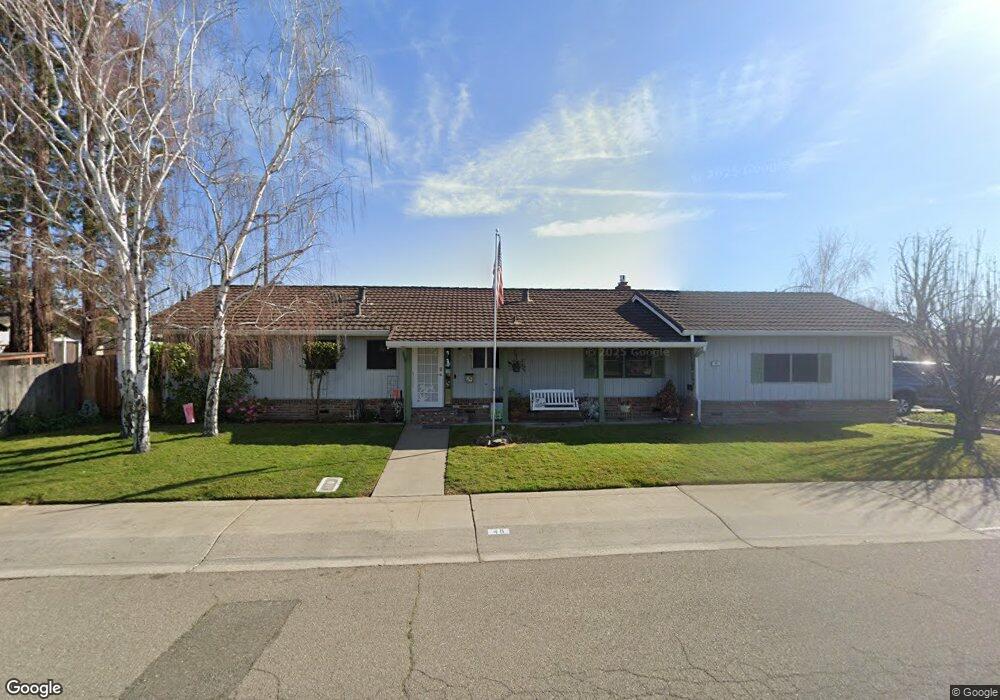
About This Home
This home is located at 48 N Allen Dr, Lodi, CA 95242 and is currently estimated at $474,236, approximately $337 per square foot. 48 N Allen Dr is a home located in San Joaquin County with nearby schools including Erma B. Reese Elementary School, Millswood Middle School, and Lodi High School.
Ownership History
We collect this data history from publicly available records. To have your information removed, we recommend requesting removal directly through your county’s website.
Purchase Details
Purchase Details
Home Values in the Area
Average Home Value in this Area
Purchase History
We collect this data history from publicly available records. To have your information removed, we recommend requesting removal directly through your county’s website.
| Date | Buyer | Sale Price | Title Company |
|---|---|---|---|
| -- | None Available | ||
| -- | First American |
Mortgage History
We collect this data history from publicly available records. To have your information removed, we recommend requesting removal directly through your county’s website.
| Date | Status | Borrower | Loan Amount |
|---|---|---|---|
| Open | $80,000 |
Tax History
We collect this data history from publicly available records. To have your information removed, we recommend requesting removal directly through your county’s website.
| Year | Tax Paid | Tax Assessment Tax Assessment Total Assessment is a certain percentage of the fair market value that is determined by local assessors to be the total taxable value of land and additions on the property. | Land | Improvement |
|---|---|---|---|---|
| 2025 | $1,239 | $120,101 | $18,475 | $101,626 |
| 2024 | $1,204 | $117,747 | $18,113 | $99,634 |
| 2023 | $1,189 | $115,439 | $17,758 | $97,681 |
| 2022 | $1,161 | $113,176 | $17,410 | $95,766 |
| 2021 | $1,180 | $110,958 | $17,069 | $93,889 |
| 2020 | $1,149 | $109,821 | $16,894 | $92,927 |
| 2019 | $1,125 | $107,668 | $16,563 | $91,105 |
| 2018 | $1,108 | $105,558 | $16,239 | $89,319 |
| 2017 | $1,082 | $103,489 | $15,921 | $87,568 |
| 2016 | $1,013 | $101,460 | $15,609 | $85,851 |
| 2015 | $1,001 | $99,937 | $15,375 | $84,562 |
| 2014 | $987 | $97,980 | $15,074 | $82,906 |
Map
- 2149 Debbie Ln
- 8 N Cambridge Dr
- 1901 W Locust St
- 2427 Macarthur Pkwy
- 206 Benson Dr
- 88 Westbrook Dr
- 2486 Central Park Dr
- 2572 Douglas Fir Dr
- 1712 W Locust St
- 2561 Central Park Dr
- 1813 Jackson St
- 2639 Creekside Dr
- 2681 Ponderosa Dr
- 2664 Ponderosa Dr
- 1437 W Elm St
- 116 Evergreen Dr
- 2403 Tejon St
- 185 Jubilee St
- 501 Cross St
- 2640 Tiffany St
Ask me questions while you tour the home.