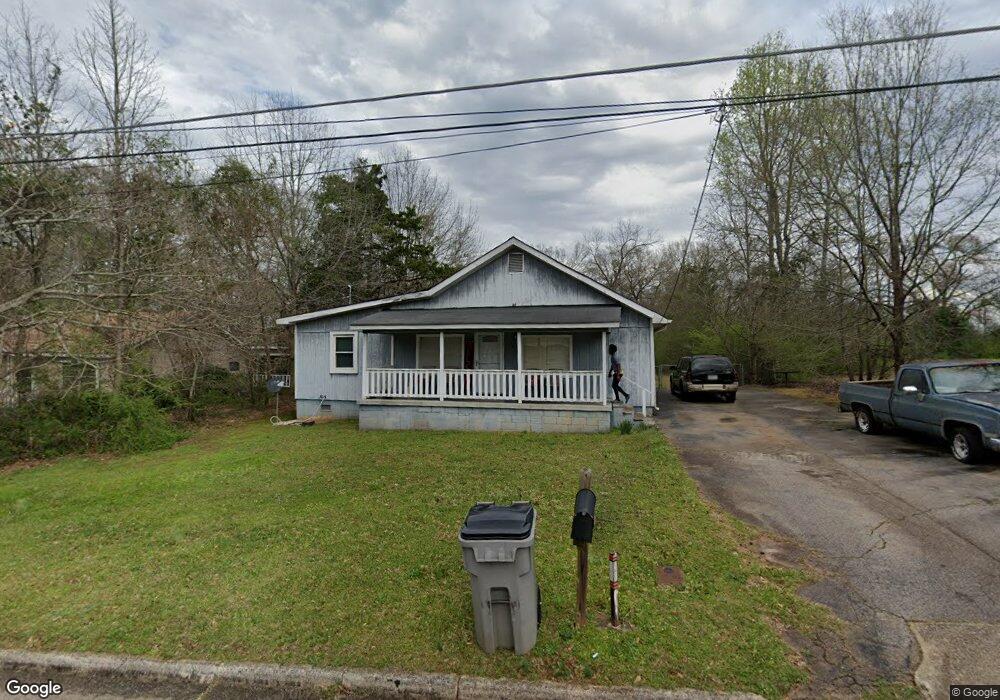
48 N Cary St Lagrange, GA 30241
Estimated Value: $84,000 - $198,000
3
Beds
2
Baths
1,336
Sq Ft
$107/Sq Ft
Est. Value
About This Home
This home is located at 48 N Cary St, Lagrange, GA 30241 and is currently estimated at $143,385, approximately $107 per square foot. 48 N Cary St is a home located in Troup County with nearby schools including Callaway Elementary School, Hogansville Elementary School, and Callaway Middle School.
Ownership History
Date
Name
Owned For
Owner Type
Purchase Details
Closed on
May 25, 2022
Sold by
Mccarthy James P
Bought by
Crylan Properties Llc
Current Estimated Value
Purchase Details
Closed on
Apr 4, 2006
Sold by
Suntrust Mtg Inc
Bought by
Sec Of Housing & Urban
Purchase Details
Closed on
Apr 28, 2003
Sold by
Jose Cruz
Bought by
Suntrust Mortgage Inc
Purchase Details
Closed on
Jul 5, 2000
Sold by
Linda Elaine Bailey Williams
Bought by
Jose Cruz
Purchase Details
Closed on
Aug 18, 1999
Sold by
Gladstone Bailey
Bought by
Linda Elaine Bailey Williams
Purchase Details
Closed on
May 23, 1983
Sold by
George Priscilla and George Sheridan
Bought by
Gladstone Bailey
Purchase Details
Closed on
May 13, 1983
Sold by
George Priscilla and George Sheridan
Bought by
George Priscilla and George Sheridan
Purchase Details
Closed on
Mar 1, 1969
Sold by
J R and Dora Rigsby
Bought by
George Priscilla and George Sheridan
Create a Home Valuation Report for This Property
The Home Valuation Report is an in-depth analysis detailing your home's value as well as a comparison with similar homes in the area
Purchase History
| Date | Buyer | Sale Price | Title Company |
|---|---|---|---|
| Crylan Properties Llc | $140,000 | -- | |
| Sec Of Housing & Urban | -- | -- | |
| Suntrust Mtg Inc | -- | -- | |
| Suntrust Mortgage Inc | $78,000 | -- | |
| Jose Cruz | $62,600 | -- | |
| Linda Elaine Bailey Williams | -- | -- | |
| Gladstone Bailey | -- | -- | |
| George Priscilla | $25,000 | -- | |
| George Priscilla | -- | -- |
Source: Public Records
Tax History
| Year | Tax Paid | Tax Assessment Tax Assessment Total Assessment is a certain percentage of the fair market value that is determined by local assessors to be the total taxable value of land and additions on the property. | Land | Improvement |
|---|---|---|---|---|
| 2025 | $747 | $29,760 | $2,600 | $27,160 |
| 2024 | $747 | $27,400 | $2,600 | $24,800 |
| 2023 | $580 | $25,520 | $2,600 | $22,920 |
| 2022 | $675 | $24,200 | $2,600 | $21,600 |
| 2021 | $571 | $18,920 | $2,600 | $16,320 |
| 2020 | $571 | $18,920 | $2,600 | $16,320 |
| 2019 | $538 | $17,840 | $2,600 | $15,240 |
| 2018 | $522 | $17,320 | $2,600 | $14,720 |
| 2017 | $522 | $17,320 | $2,600 | $14,720 |
| 2016 | $509 | $16,882 | $2,564 | $14,318 |
| 2015 | $510 | $16,882 | $2,564 | $14,318 |
| 2014 | $488 | $16,129 | $2,564 | $13,565 |
| 2013 | -- | $17,236 | $2,564 | $14,672 |
Source: Public Records
Map
Nearby Homes
- 227 River Meadow Dr Unit H14
- 227 River Meadow Dr
- 412 Sweetwood Ct Unit A36
- 304 Bridgette Blvd
- 101 Sarah Ln
- 0 N Barnard Ave
- 107 N Barnard Ave
- 130 Clara Jean Ct
- 5 Gulfstream Dr
- 3 Gulfstream Dr
- 115 Clara Jean Ct
- 110 Lenox Cir
- 305 Lenox Cir
- 212 Cleveland Dr
- 204 Cleveland Dr
- Coleman Plan at Crossvine Village
- Beckman Plan at Crossvine Village
- Fairfield Plan at Crossvine Village
- Broadmoor Plan at Crossvine Village
- Dover Plan at Crossvine Village
- 50 N Cary St
- 52 N Cary St
- 31 Sanford Ave
- 101 Sanford Ave
- 101 Sanford Ave Unit 42
- 29 Sanford Ave
- 31 N Sanford Ave
- 27 Sanford Ave
- 54 N Cary St
- 103 Sandford Ave
- 103 Sanford Ave
- 65 Sanford Ave
- 25 Sanford Ave
- 25 N Sanford Ave
- 56 N Cary St
- 105 Sanford Ave
- 105 Sanford Ave Unit 44
- 30 Sanford Ave
- 23 Sanford Ave
- 103 N Sanford Ave