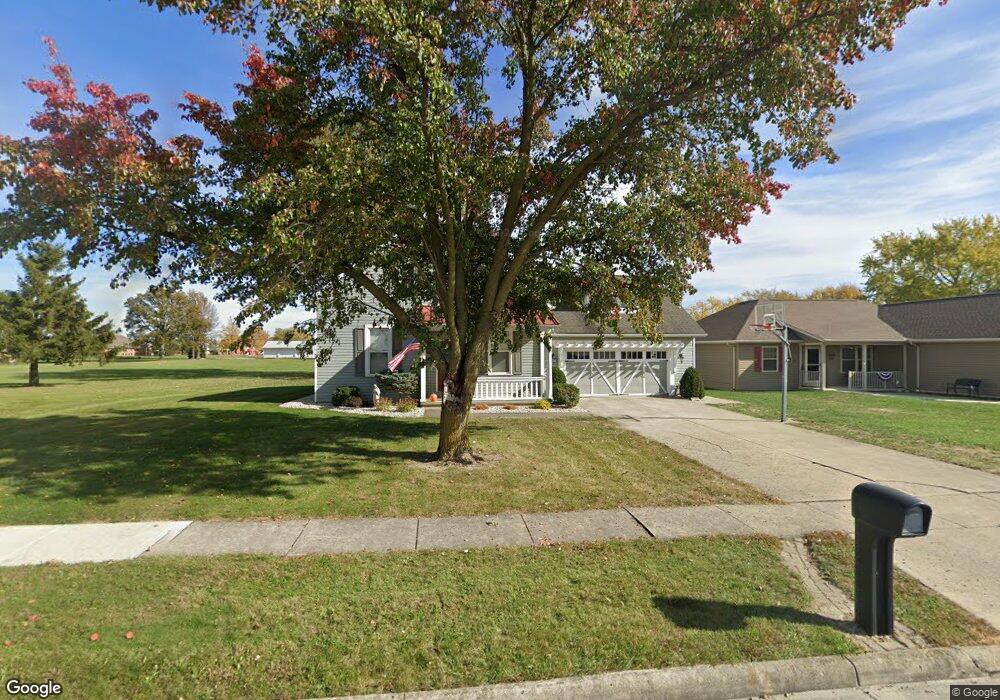
48 N Garfield St Minster, OH 45865
Estimated Value: $299,000 - $368,000
4
Beds
2
Baths
1,428
Sq Ft
$238/Sq Ft
Est. Value
About This Home
This home is located at 48 N Garfield St, Minster, OH 45865 and is currently estimated at $339,503, approximately $237 per square foot. 48 N Garfield St is a home located in Auglaize County with nearby schools including Minster Elementary School and Minster Junior/Senior High School.
Ownership History
Date
Name
Owned For
Owner Type
Purchase Details
Closed on
Sep 23, 2010
Sold by
Fullenkamp Charles and Fullenkamp Mary Lou
Bought by
Winner Alan R and Ernst Kimberly M
Current Estimated Value
Home Financials for this Owner
Home Financials are based on the most recent Mortgage that was taken out on this home.
Original Mortgage
$170,701
Outstanding Balance
$113,062
Interest Rate
4.5%
Mortgage Type
FHA
Estimated Equity
$226,441
Purchase Details
Closed on
Dec 4, 2009
Sold by
Nationstar Mortgage Llc
Bought by
Fullenkamp Charles
Purchase Details
Closed on
Sep 30, 2009
Sold by
Brandewie Bart W and Brandewie Robin L
Bought by
Nationstar Mortgage Llc and Centex Home Equity Company Llc
Purchase Details
Closed on
Jun 3, 1996
Sold by
Morsey Paul J
Bought by
Brandewie Bart W
Purchase Details
Closed on
Mar 27, 1996
Sold by
Morsey Royal J
Bought by
Morsey Paul J
Create a Home Valuation Report for This Property
The Home Valuation Report is an in-depth analysis detailing your home's value as well as a comparison with similar homes in the area
Home Values in the Area
Average Home Value in this Area
Purchase History
| Date | Buyer | Sale Price | Title Company |
|---|---|---|---|
| Winner Alan R | $173,000 | Attorney | |
| Fullenkamp Charles | $103,000 | Prism Title & Closing Svcs | |
| Nationstar Mortgage Llc | -- | Attorney | |
| Brandewie Bart W | $19,500 | -- | |
| Morsey Paul J | -- | -- |
Source: Public Records
Mortgage History
| Date | Status | Borrower | Loan Amount |
|---|---|---|---|
| Open | Winner Alan R | $170,701 |
Source: Public Records
Tax History Compared to Growth
Tax History
| Year | Tax Paid | Tax Assessment Tax Assessment Total Assessment is a certain percentage of the fair market value that is determined by local assessors to be the total taxable value of land and additions on the property. | Land | Improvement |
|---|---|---|---|---|
| 2024 | $5,915 | $85,150 | $15,740 | $69,410 |
| 2023 | $2,883 | $85,150 | $15,740 | $69,410 |
| 2022 | $2,624 | $72,010 | $14,440 | $57,570 |
| 2021 | $2,681 | $72,010 | $14,440 | $57,570 |
| 2020 | $1,379 | $72,017 | $14,445 | $57,572 |
| 2019 | $2,414 | $59,178 | $11,872 | $47,306 |
| 2018 | $2,414 | $59,178 | $11,872 | $47,306 |
| 2017 | $2,239 | $59,178 | $11,872 | $47,306 |
| 2016 | $2,018 | $52,081 | $10,770 | $41,311 |
| 2015 | $1,983 | $52,081 | $10,770 | $41,311 |
| 2014 | $1,986 | $52,081 | $10,770 | $41,311 |
| 2013 | $2,083 | $52,081 | $10,770 | $41,311 |
Source: Public Records
Map
Nearby Homes
- 47 N Frankfort St
- 193 N Paris St
- 17 Stonegate Dr
- 0 Stonegate Dr Unit 21 10544857
- 0 Stonegate Dr Unit 14 10544847
- 36 Shania Place Unit 23
- 27 Shania Place Unit 26
- 19 Shania Place Unit 33
- 28 Shania Place Unit 33
- 11 Shania Place Unit 28
- 561 S Walnut St Unit Lot3
- 12600 E Shelby Rd
- 12244 Short Dr Unit Condo Unit 10
- 129 Janice Dr
- 133 Janice Dr
- 130 Janice Dr
- 137 Janice Dr
- 141 Janice Dr
- 145 Janice Dr
- 149 Janice Dr
- 40 N Garfield St
- 32 N Garfield St
- 24 N Garfield St
- 45 N Jefferson St
- 35 N Jefferson St
- 16 N Garfield St
- 308 E 4th St
- 15 N Jefferson St
- 394 E 4th St
- 273 E 5th St Unit 1
- 68 N Jefferson St
- 265 E 5th St
- 257 E 5th St
- 24 N Jefferson St
- 307 E 4th St
- 48 N Jefferson St
- 249 E 5th St
- 359 E 4th St
- 341 E 4th St
- 106 N Garfield St