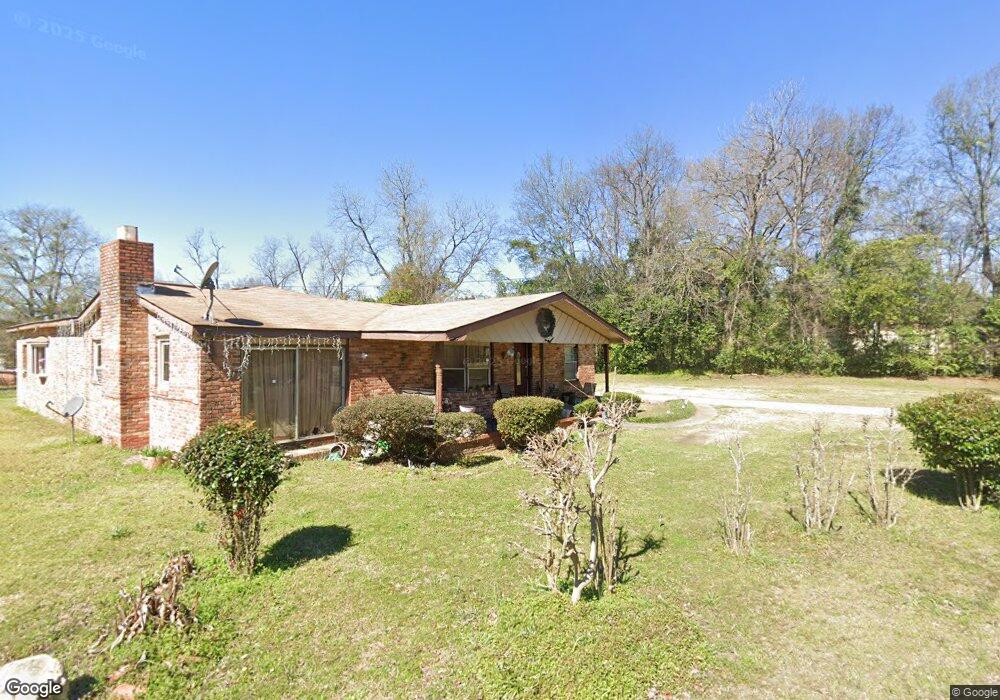
48 N Jones St Fort Valley, GA 31030
Estimated Value: $151,806 - $173,000
3
Beds
2
Baths
1,821
Sq Ft
$88/Sq Ft
Est. Value
About This Home
This home is located at 48 N Jones St, Fort Valley, GA 31030 and is currently estimated at $160,702, approximately $88 per square foot. 48 N Jones St is a home located in Peach County with nearby schools including Hunt Elementary School, Fort Valley Middle School, and Peach County High School.
Ownership History
Date
Name
Owned For
Owner Type
Purchase Details
Closed on
Jul 10, 1992
Bought by
Brown Carolyn
Current Estimated Value
Purchase Details
Closed on
May 31, 1975
Bought by
Brown Kay Marshall
Purchase Details
Closed on
Oct 18, 1952
Bought by
Brown Andrew and Brown Carolyn
Create a Home Valuation Report for This Property
The Home Valuation Report is an in-depth analysis detailing your home's value as well as a comparison with similar homes in the area
Home Values in the Area
Average Home Value in this Area
Purchase History
| Date | Buyer | Sale Price | Title Company |
|---|---|---|---|
| Brown Carolyn | -- | -- | |
| Brown Kay Marshall | -- | -- | |
| Brown Andrew | -- | -- |
Source: Public Records
Tax History Compared to Growth
Tax History
| Year | Tax Paid | Tax Assessment Tax Assessment Total Assessment is a certain percentage of the fair market value that is determined by local assessors to be the total taxable value of land and additions on the property. | Land | Improvement |
|---|---|---|---|---|
| 2024 | $1,352 | $43,000 | $6,000 | $37,000 |
| 2023 | $1,147 | $35,040 | $4,120 | $30,920 |
| 2022 | $1,058 | $31,720 | $4,120 | $27,600 |
| 2021 | $1,012 | $25,880 | $4,120 | $21,760 |
| 2020 | $1,176 | $31,120 | $6,360 | $24,760 |
| 2019 | $1,180 | $31,120 | $6,360 | $24,760 |
| 2018 | $1,185 | $31,120 | $6,360 | $24,760 |
| 2017 | $537 | $26,800 | $6,360 | $20,440 |
| 2016 | $577 | $29,600 | $6,360 | $23,240 |
| 2015 | $531 | $26,440 | $3,200 | $23,240 |
| 2014 | $535 | $26,720 | $3,200 | $23,520 |
| 2013 | -- | $26,720 | $3,200 | $23,520 |
Source: Public Records
Map
Nearby Homes
- 65 N Jones St
- 31 Vandaway St
- 110 N Jones St
- 115 Friendship Cir
- 115 Friendship Cir Unit 38 Vanderbuilt St.
- 115 Friendship Cir Unit 121-123 Friendship C
- 65 Vandaway St
- 1366 State University Dr
- 37 N Jones St
- 1344 State University Dr Unit 1
- 1344 State University Dr Unit 3
- 1344 State University Dr
- 121 Friendship Cir
- 0 Vandaway St Unit 7162534
- 121 & 123 Friendship Circle Cir
- 83 Friendship Cir
- 38 Vandaway St
- 0 Friendship Cir Unit 7621329
- 0 Friendship Cir Unit 8403745
- 0 Friendship Cir Unit 7347857