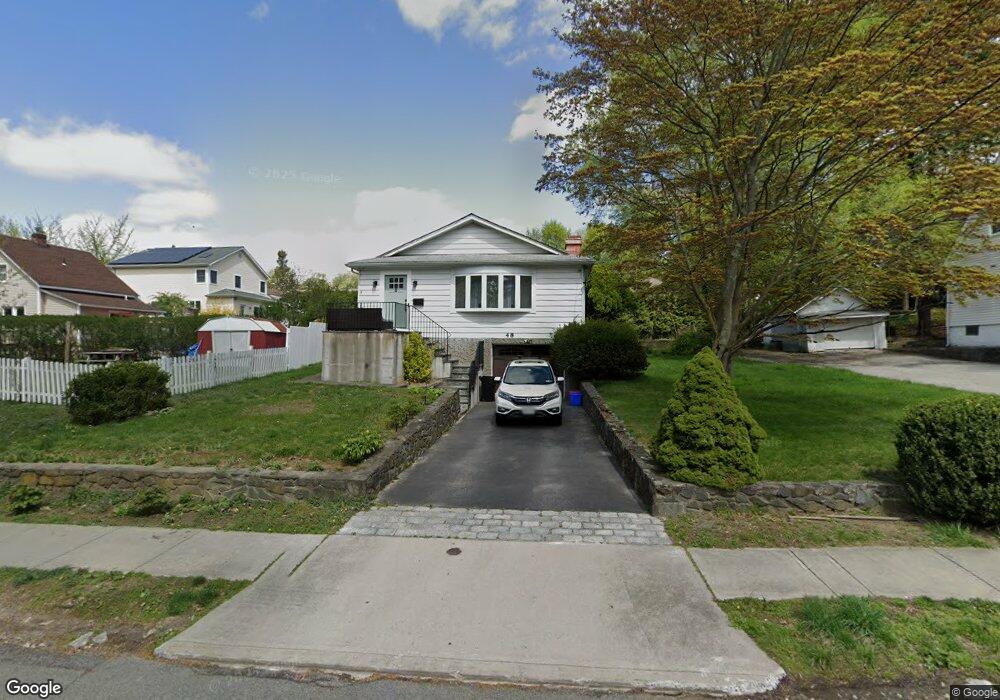
48 Olcott Ave Croton On Hudson, NY 10520
Estimated Value: $637,559 - $801,000
--
Bed
--
Bath
--
Sq Ft
8,276
Sq Ft Lot
About This Home
This home is located at 48 Olcott Ave, Croton On Hudson, NY 10520 and is currently estimated at $720,140. 48 Olcott Ave is a home located in Westchester County with nearby schools including Carrie E Tompkins School, Pierre Van Cortlandt Middle School, and St. Augustine School.
Ownership History
Date
Name
Owned For
Owner Type
Purchase Details
Closed on
Oct 7, 2021
Sold by
Meyer Christian and Meyer Marni
Bought by
Meyer Marni
Current Estimated Value
Home Financials for this Owner
Home Financials are based on the most recent Mortgage that was taken out on this home.
Original Mortgage
$390,000
Outstanding Balance
$355,644
Interest Rate
2.8%
Mortgage Type
New Conventional
Estimated Equity
$364,496
Purchase Details
Closed on
Jul 27, 2005
Sold by
Bleakley Bettina M and Calcutti Michelle A
Bought by
Meyer Christian and Meyer Marni
Purchase Details
Closed on
Nov 25, 1996
Sold by
Mackenzie Bonnie L
Bought by
Bleakley Bettina and Bleakley Frank
Create a Home Valuation Report for This Property
The Home Valuation Report is an in-depth analysis detailing your home's value as well as a comparison with similar homes in the area
Home Values in the Area
Average Home Value in this Area
Purchase History
| Date | Buyer | Sale Price | Title Company |
|---|---|---|---|
| Meyer Marni | -- | Judicial Title Insurance | |
| Meyer Christian | $449,900 | -- | |
| Bleakley Bettina | $157,500 | Commonwealth Land Title Ins |
Source: Public Records
Mortgage History
| Date | Status | Borrower | Loan Amount |
|---|---|---|---|
| Open | Meyer Marni | $390,000 |
Source: Public Records
Tax History Compared to Growth
Tax History
| Year | Tax Paid | Tax Assessment Tax Assessment Total Assessment is a certain percentage of the fair market value that is determined by local assessors to be the total taxable value of land and additions on the property. | Land | Improvement |
|---|---|---|---|---|
| 2024 | $14,274 | $6,200 | $650 | $5,550 |
| 2023 | $13,980 | $6,200 | $650 | $5,550 |
| 2022 | $8,057 | $6,200 | $650 | $5,550 |
| 2021 | $1,775 | $6,200 | $650 | $5,550 |
| 2020 | $11,736 | $6,200 | $650 | $5,550 |
| 2019 | $10,579 | $6,200 | $650 | $5,550 |
| 2018 | $13,743 | $5,900 | $650 | $5,250 |
| 2017 | $0 | $5,725 | $475 | $5,250 |
| 2016 | $11,862 | $5,725 | $475 | $5,250 |
| 2015 | -- | $5,725 | $475 | $5,250 |
| 2014 | -- | $5,725 | $475 | $5,250 |
| 2013 | -- | $5,725 | $475 | $5,250 |
Source: Public Records
Map
Nearby Homes
- 34 Ridge Rd
- 56 Irving Ave
- 102 Maple St
- D-20 Half Moon Bay Marina
- B-11 Half Moon Bay Marina Unit B-11
- 25 S Riverside Ave Unit 201
- 25 S Riverside Ave Unit 308
- 25 S Riverside Ave Unit 108
- 25 S Riverside Ave Unit 211
- 38 Nordica Dr
- 170 Grand St
- 35 Brook St
- 99 Quaker Bridge Rd
- 1 Wood Rd
- 19 Hunter St
- 1706 Half Moon Bay Dr Unit 1706
- 72 Old Post Rd N
- 43 High St
- 1200 Half Moon Bay Dr
- 20 Wolf Rd