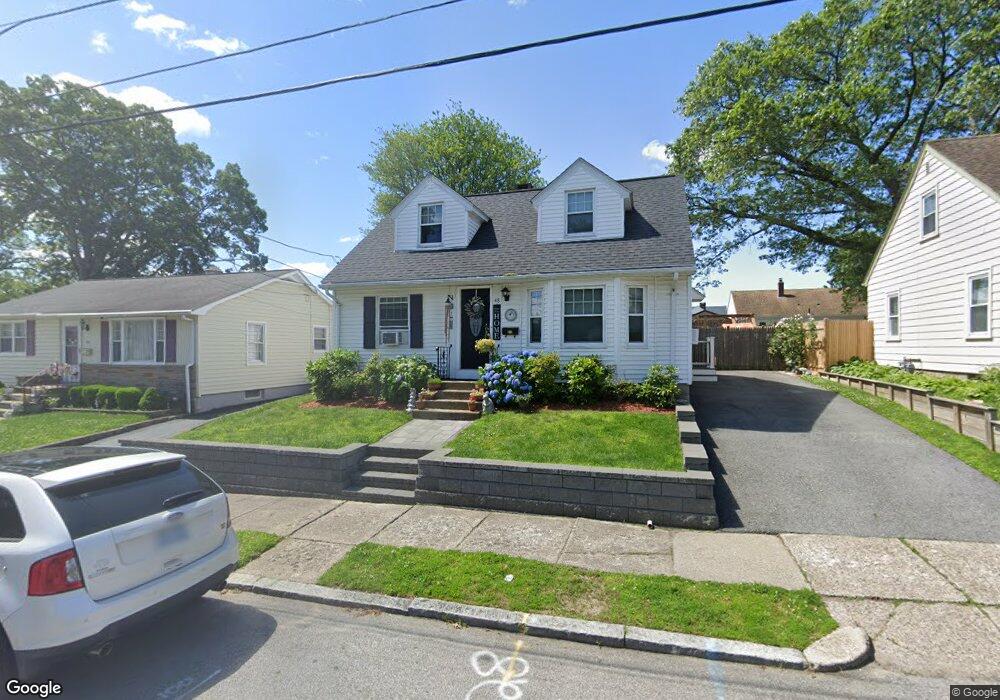
48 Owen Ave Pawtucket, RI 02860
Fairlawn NeighborhoodEstimated Value: $361,177 - $401,000
2
Beds
1
Bath
1,099
Sq Ft
$344/Sq Ft
Est. Value
About This Home
This home is located at 48 Owen Ave, Pawtucket, RI 02860 and is currently estimated at $378,294, approximately $344 per square foot. 48 Owen Ave is a home located in Providence County with nearby schools including Blackstone Valley Prep Upper Elementary School, Blackstone Valley Prep Junior High School, and Bishop Keough Regional High School.
Ownership History
Date
Name
Owned For
Owner Type
Purchase Details
Closed on
Jul 1, 1999
Sold by
Tretton John J and Tretton David
Bought by
Mooney Scott A and Lafeiriere Michelle L
Current Estimated Value
Home Financials for this Owner
Home Financials are based on the most recent Mortgage that was taken out on this home.
Original Mortgage
$92,434
Interest Rate
7.19%
Create a Home Valuation Report for This Property
The Home Valuation Report is an in-depth analysis detailing your home's value as well as a comparison with similar homes in the area
Home Values in the Area
Average Home Value in this Area
Purchase History
| Date | Buyer | Sale Price | Title Company |
|---|---|---|---|
| Mooney Scott A | $93,500 | -- |
Source: Public Records
Mortgage History
| Date | Status | Borrower | Loan Amount |
|---|---|---|---|
| Open | Mooney Scott A | $147,028 | |
| Closed | Mooney Scott A | $25,000 | |
| Closed | Mooney Scott A | $92,434 |
Source: Public Records
Tax History Compared to Growth
Tax History
| Year | Tax Paid | Tax Assessment Tax Assessment Total Assessment is a certain percentage of the fair market value that is determined by local assessors to be the total taxable value of land and additions on the property. | Land | Improvement |
|---|---|---|---|---|
| 2025 | $3,458 | $263,000 | $125,500 | $137,500 |
| 2024 | $3,245 | $263,000 | $125,500 | $137,500 |
| 2023 | $3,132 | $184,900 | $68,400 | $116,500 |
| 2022 | $3,066 | $184,900 | $68,400 | $116,500 |
| 2021 | $3,066 | $184,900 | $68,400 | $116,500 |
| 2020 | $3,111 | $148,900 | $63,100 | $85,800 |
| 2019 | $3,111 | $148,900 | $63,100 | $85,800 |
| 2018 | $2,997 | $148,900 | $63,100 | $85,800 |
| 2017 | $3,110 | $136,900 | $57,000 | $79,900 |
| 2016 | $2,997 | $136,900 | $57,000 | $79,900 |
| 2015 | $2,997 | $136,900 | $57,000 | $79,900 |
| 2014 | $2,931 | $127,100 | $57,000 | $70,100 |
Source: Public Records
Map
Nearby Homes
- 422 Smithfield Ave Unit 1
- 424 Smithfield Ave Unit 1
- 149 Oakdale Ave
- 123 Francis Ave
- 221 Columbia Ave
- 136 Samuel Ave
- 199 Morris Ave
- 12 Legion Dr
- 16 Rufus St
- 584 Weeden St
- 132 Hobson Ave
- 56 Legion Dr
- 168 W Forest Ave
- 533 Weeden St
- 75 Elder St
- 27 Stedman Ave
- 0 Martha St
- 0 Hazel St
- 2 Cobble Hill Rd
- 21 Urban Ave