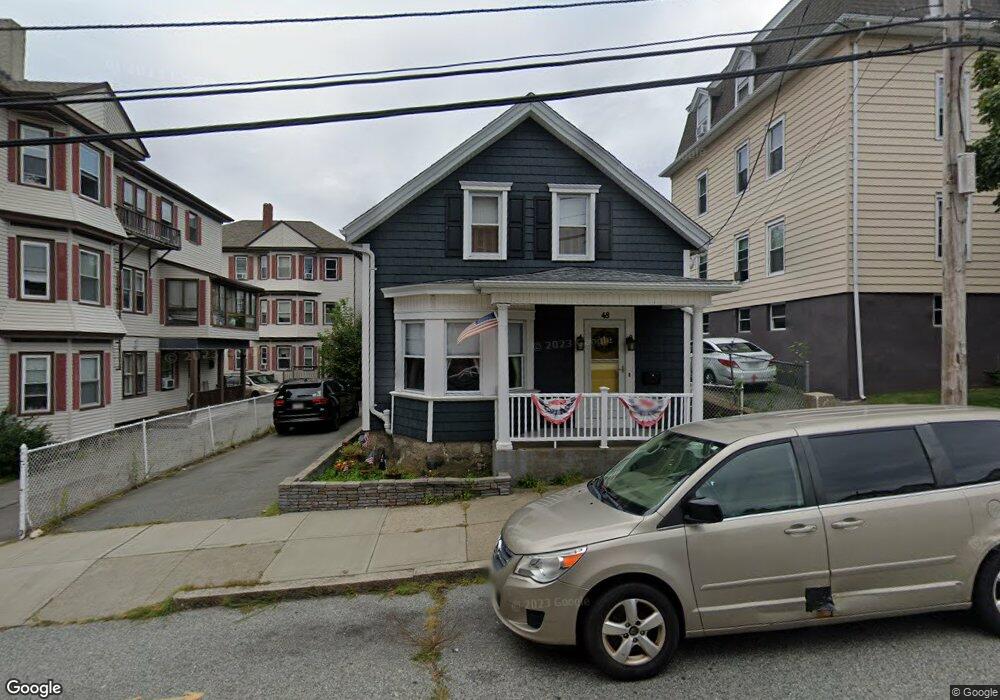
48 Park St Fall River, MA 02721
Corky Row NeighborhoodEstimated Value: $308,000 - $358,000
3
Beds
1
Bath
1,399
Sq Ft
$243/Sq Ft
Est. Value
About This Home
This home is located at 48 Park St, Fall River, MA 02721 and is currently estimated at $339,534, approximately $242 per square foot. 48 Park St is a home located in Bristol County with nearby schools including Henry Lord Community School, B M C Durfee High School, and Argosy Collegiate Charter School.
Ownership History
Date
Name
Owned For
Owner Type
Purchase Details
Closed on
Jan 6, 2004
Sold by
Vezina Albert R
Bought by
Harrington James P
Current Estimated Value
Home Financials for this Owner
Home Financials are based on the most recent Mortgage that was taken out on this home.
Original Mortgage
$156,750
Interest Rate
5.86%
Mortgage Type
Purchase Money Mortgage
Create a Home Valuation Report for This Property
The Home Valuation Report is an in-depth analysis detailing your home's value as well as a comparison with similar homes in the area
Home Values in the Area
Average Home Value in this Area
Purchase History
| Date | Buyer | Sale Price | Title Company |
|---|---|---|---|
| Harrington James P | $165,000 | -- |
Source: Public Records
Mortgage History
| Date | Status | Borrower | Loan Amount |
|---|---|---|---|
| Open | Harrington James P | $138,000 | |
| Closed | Harrington James P | $146,000 | |
| Closed | Harrington James P | $156,750 |
Source: Public Records
Tax History
| Year | Tax Paid | Tax Assessment Tax Assessment Total Assessment is a certain percentage of the fair market value that is determined by local assessors to be the total taxable value of land and additions on the property. | Land | Improvement |
|---|---|---|---|---|
| 2025 | $3,179 | $277,600 | $105,200 | $172,400 |
| 2024 | $2,995 | $260,700 | $101,300 | $159,400 |
| 2023 | $2,764 | $225,300 | $83,700 | $141,600 |
| 2022 | $2,585 | $204,800 | $79,700 | $125,100 |
| 2021 | $2,416 | $174,700 | $75,800 | $98,900 |
| 2020 | $2,448 | $169,400 | $74,700 | $94,700 |
| 2019 | $2,352 | $161,300 | $72,000 | $89,300 |
| 2018 | $2,259 | $154,500 | $77,900 | $76,600 |
| 2017 | $2,101 | $150,100 | $74,300 | $75,800 |
| 2016 | $2,055 | $150,800 | $79,100 | $71,700 |
| 2015 | $1,972 | $150,800 | $79,100 | $71,700 |
| 2014 | $1,867 | $148,400 | $76,700 | $71,700 |
Source: Public Records
Map
Nearby Homes
- 150 Forest St
- 105 Park St
- 640 S Main St
- 111 Park St
- 928 Middle St
- 165 Grant St
- 169 Grant St
- 621 Second St
- 141 Hunter St
- 334 Fountain St
- 48 Ridge St
- 81 Hunter St
- 271 Mulberry St
- 75 Hunter St
- 77 Hunter St
- 403 Division St Unit 13
- 403 Division St Unit 5
- 403 Division St Unit 9
- 403 Division St Unit 11
- 403 Division St Unit 12
- 34-36 Park St
- 40 Park St
- 40 Park St Unit 2
- 40 Park St Unit 1
- 40 Park St Unit 3
- 58-60 Park St Unit 3
- 81 Forest St
- 81 Forest St Unit 3
- 73 Forest St
- 73 Forest St Unit 2
- 20 Park St
- 78 Park St
- 55 Forest St
- 55 Forest St Unit 1
- 720 S Main St
- 92 Park St
- 64 Forest St
- 64 Forest St Unit 2
- 64 Forest St Unit 3
- 64 Forest St Unit 1
Your Personal Tour Guide
Ask me questions while you tour the home.