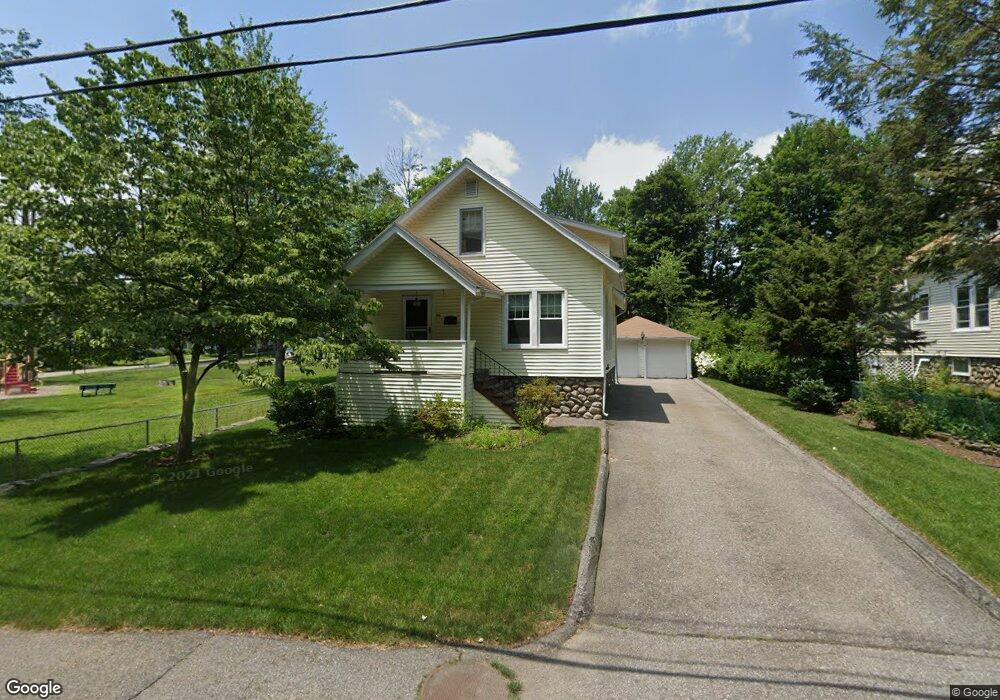
48 Phillips Rd Unit 11 Holden, MA 01520
Estimated Value: $328,000 - $349,697
2
Beds
2
Baths
1,255
Sq Ft
$272/Sq Ft
Est. Value
About This Home
This home is located at 48 Phillips Rd Unit 11, Holden, MA 01520 and is currently estimated at $341,174, approximately $271 per square foot. 48 Phillips Rd Unit 11 is a home located in Worcester County with nearby schools including Wachusett Regional High School, Holden Christian Academy, and Bancroft School.
Ownership History
Date
Name
Owned For
Owner Type
Purchase Details
Closed on
Dec 15, 2021
Sold by
Lofgren Stephen P and Lofgren Thea B
Bought by
Davis Janet M
Current Estimated Value
Home Financials for this Owner
Home Financials are based on the most recent Mortgage that was taken out on this home.
Original Mortgage
$125,000
Outstanding Balance
$114,936
Interest Rate
3.09%
Mortgage Type
Purchase Money Mortgage
Estimated Equity
$226,238
Purchase Details
Closed on
Jul 30, 2018
Sold by
Rice Holden Llc
Bought by
Lofgren Stephen P and Lofgren Thea B
Purchase Details
Closed on
Mar 12, 2018
Sold by
Diane E Abramson
Bought by
Godbout Nathalie
Home Financials for this Owner
Home Financials are based on the most recent Mortgage that was taken out on this home.
Original Mortgage
$187,520
Interest Rate
4.46%
Create a Home Valuation Report for This Property
The Home Valuation Report is an in-depth analysis detailing your home's value as well as a comparison with similar homes in the area
Home Values in the Area
Average Home Value in this Area
Purchase History
| Date | Buyer | Sale Price | Title Company |
|---|---|---|---|
| Davis Janet M | $285,000 | None Available | |
| Lofgren Stephen P | $219,000 | -- | |
| Godbout Nathalie | $154,000 | -- |
Source: Public Records
Mortgage History
| Date | Status | Borrower | Loan Amount |
|---|---|---|---|
| Open | Davis Janet M | $125,000 | |
| Previous Owner | Godbout Nathalie | $187,520 | |
| Previous Owner | Godbout Nathalie | -- |
Source: Public Records
Tax History
| Year | Tax Paid | Tax Assessment Tax Assessment Total Assessment is a certain percentage of the fair market value that is determined by local assessors to be the total taxable value of land and additions on the property. | Land | Improvement |
|---|---|---|---|---|
| 2025 | $4,615 | $333,000 | $0 | $333,000 |
| 2024 | $4,112 | $290,600 | $0 | $290,600 |
| 2023 | $3,963 | $264,400 | $0 | $264,400 |
| 2022 | $3,497 | $211,200 | $0 | $211,200 |
| 2021 | $3,374 | $193,900 | $0 | $193,900 |
| 2020 | $3,570 | $210,000 | $0 | $210,000 |
| 2019 | $3,717 | $213,000 | $0 | $213,000 |
| 2018 | $3,484 | $200,200 | $0 | $200,200 |
| 2017 | $3,411 | $193,900 | $0 | $193,900 |
| 2016 | $3,271 | $189,600 | $0 | $189,600 |
| 2015 | $3,320 | $183,200 | $0 | $183,200 |
| 2014 | $3,252 | $183,200 | $0 | $183,200 |
Source: Public Records
Map
Nearby Homes
- 63 Walnut St
- 136 Winthrop Ln
- 135 Highland Ave
- 134 Jamieson Rd
- 81 Deanna Dr
- 4 Deanna Dr
- 1 Kris Alan Dr
- 16 Pine Tree Rd Unit A
- 21 Pine Tree Rd Unit A
- 21 Pine Tree Rd Unit B
- 15 Pine Tree Rd Unit A
- 15 Pine Tree Rd Unit C
- 15 Pine Tree Rd Unit B
- 216 Reservoir St Unit 107
- 216 Reservoir St Unit 208
- 216 Reservoir St Unit 202
- 218 Reservoir St Unit 326
- 35 Laurel Hill Ln
- 30 Duxbury Dr
- 64 Kendall Rd
- 48 Phillips Rd Unit 25
- 48 Phillips Rd Unit 24
- 48 Phillips Rd Unit 23
- 48 Phillips Rd Unit 22
- 48 Phillips Rd Unit 21
- 48 Phillips Rd Unit 20
- 48 Phillips Rd Unit 19
- 48 Phillips Rd Unit 18
- 48 Phillips Rd Unit 17
- 48 Phillips Rd Unit 16
- 48 Phillips Rd Unit 15
- 48 Phillips Rd Unit 13
- 48 Phillips Rd Unit 12
- 42 Phillips Rd Unit 10
- 42 Phillips Rd Unit 9
- 42 Phillips Rd Unit 8
- 42 Phillips Rd Unit 7
- 42 Phillips Rd Unit 6
- 42 Phillips Rd Unit 4
- 42 Phillips Rd Unit 3
Your Personal Tour Guide
Ask me questions while you tour the home.