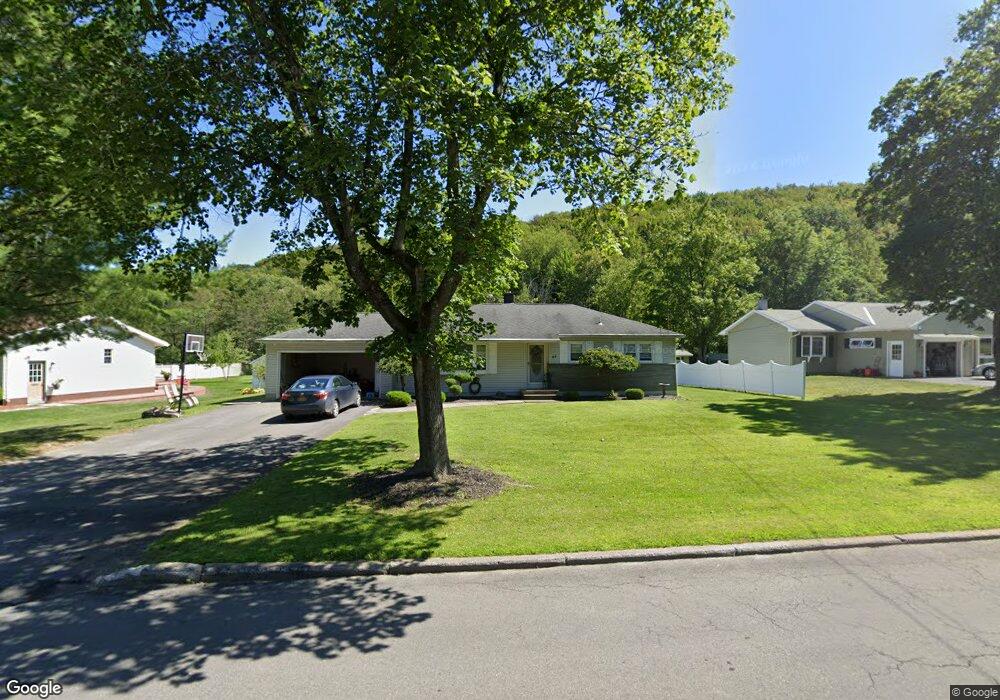
48 Pond Ln Utica, NY 13501
East Utica NeighborhoodEstimated Value: $247,799 - $304,000
3
Beds
2
Baths
1,228
Sq Ft
$228/Sq Ft
Est. Value
About This Home
This home is located at 48 Pond Ln, Utica, NY 13501 and is currently estimated at $279,450, approximately $227 per square foot. 48 Pond Ln is a home located in Oneida County with nearby schools including Thomas R. Proctor High School, Tradewinds Education Center, and Upstate Cerebral Palsy Inc.
Ownership History
Date
Name
Owned For
Owner Type
Purchase Details
Closed on
Mar 22, 2018
Sold by
Conley Jill
Bought by
Conley Jill and Conley Steven
Current Estimated Value
Purchase Details
Closed on
Jun 12, 2008
Sold by
Zennamo Mathew
Bought by
Conley Jill
Home Financials for this Owner
Home Financials are based on the most recent Mortgage that was taken out on this home.
Original Mortgage
$143,151
Interest Rate
6.13%
Mortgage Type
Purchase Money Mortgage
Purchase Details
Closed on
Apr 13, 2002
Create a Home Valuation Report for This Property
The Home Valuation Report is an in-depth analysis detailing your home's value as well as a comparison with similar homes in the area
Home Values in the Area
Average Home Value in this Area
Purchase History
| Date | Buyer | Sale Price | Title Company |
|---|---|---|---|
| Conley Jill | -- | -- | |
| Conley Jill | $146,000 | David P Diodati | |
| -- | -- | -- |
Source: Public Records
Mortgage History
| Date | Status | Borrower | Loan Amount |
|---|---|---|---|
| Previous Owner | Conley Jill | $143,151 |
Source: Public Records
Tax History Compared to Growth
Tax History
| Year | Tax Paid | Tax Assessment Tax Assessment Total Assessment is a certain percentage of the fair market value that is determined by local assessors to be the total taxable value of land and additions on the property. | Land | Improvement |
|---|---|---|---|---|
| 2024 | $4,829 | $73,000 | $22,300 | $50,700 |
| 2023 | $1,747 | $73,000 | $22,300 | $50,700 |
| 2022 | $2,463 | $73,000 | $22,300 | $50,700 |
| 2021 | $2,445 | $73,000 | $22,300 | $50,700 |
| 2020 | $2,350 | $73,000 | $22,300 | $50,700 |
| 2019 | $877 | $73,000 | $22,300 | $50,700 |
| 2018 | $2,897 | $73,000 | $22,300 | $50,700 |
| 2017 | $2,833 | $73,000 | $22,300 | $50,700 |
| 2016 | $3,879 | $73,000 | $22,300 | $50,700 |
| 2015 | -- | $73,000 | $22,300 | $50,700 |
| 2014 | -- | $73,000 | $22,300 | $50,700 |
Source: Public Records
Map
Nearby Homes