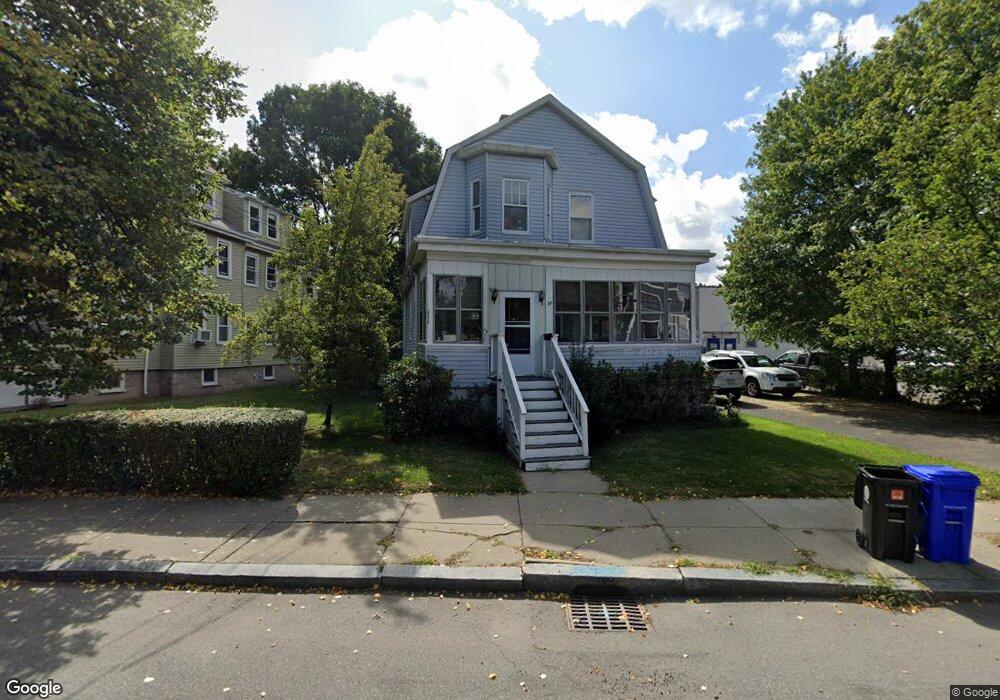
48 Quincy St Malden, MA 02148
Edgeworth NeighborhoodEstimated Value: $675,000 - $697,000
3
Beds
2
Baths
1,435
Sq Ft
$478/Sq Ft
Est. Value
About This Home
This home is located at 48 Quincy St, Malden, MA 02148 and is currently estimated at $685,866, approximately $477 per square foot. 48 Quincy St is a home located in Middlesex County with nearby schools including Medford High School and Mystic Valley Regional Charter School.
Ownership History
Date
Name
Owned For
Owner Type
Purchase Details
Closed on
Jan 4, 2023
Sold by
Dauenhauer Joseph E and Visini Claudia
Bought by
48 Quincy Street Rt
Current Estimated Value
Purchase Details
Closed on
Feb 29, 1996
Sold by
King Ann L and Mckenna Joseph W
Bought by
Pulgiese Gary
Create a Home Valuation Report for This Property
The Home Valuation Report is an in-depth analysis detailing your home's value as well as a comparison with similar homes in the area
Home Values in the Area
Average Home Value in this Area
Purchase History
| Date | Buyer | Sale Price | Title Company |
|---|---|---|---|
| 48 Quincy Street Rt | -- | None Available | |
| Pulgiese Gary | $94,900 | -- | |
| Pulgiese Gary | $94,900 | -- |
Source: Public Records
Mortgage History
| Date | Status | Borrower | Loan Amount |
|---|---|---|---|
| Previous Owner | Pulgiese Gary | $200,000 | |
| Previous Owner | Pulgiese Gary | $110,800 | |
| Previous Owner | Pulgiese Gary | $25,000 |
Source: Public Records
Tax History Compared to Growth
Tax History
| Year | Tax Paid | Tax Assessment Tax Assessment Total Assessment is a certain percentage of the fair market value that is determined by local assessors to be the total taxable value of land and additions on the property. | Land | Improvement |
|---|---|---|---|---|
| 2025 | $63 | $554,600 | $275,100 | $279,500 |
| 2024 | $5,923 | $506,700 | $259,900 | $246,800 |
| 2023 | $5,832 | $478,400 | $236,900 | $241,500 |
| 2022 | $5,544 | $448,900 | $214,000 | $234,900 |
| 2021 | $5,154 | $419,400 | $191,100 | $228,300 |
| 2020 | $5,046 | $398,900 | $184,600 | $214,300 |
| 2019 | $4,951 | $373,100 | $175,800 | $197,300 |
| 2018 | $4,715 | $334,600 | $145,200 | $189,400 |
| 2017 | $4,530 | $319,700 | $139,500 | $180,200 |
| 2016 | $4,418 | $291,400 | $128,000 | $163,400 |
| 2015 | $4,321 | $274,700 | $121,900 | $152,800 |
| 2014 | $4,144 | $257,400 | $110,800 | $146,600 |
Source: Public Records
Map
Nearby Homes
- 74 Highland Ave
- 320 Middlesex Ave Unit A207
- 320 Middlesex Ave Unit E403
- 320 Middlesex Ave Unit A406
- 320 Middlesex Ave Unit A208
- 108 Highland Ave
- 216 Central Ave Unit 218
- 42 Gibson St
- 55 Surrey St
- 830 Fellsway
- 57 1st St Unit 2
- 82 2nd St
- 217 Highland Ave Unit 1
- 45 Grant Ave
- 149 Pearl St
- 124 Grant Ave
- 500 Salem St Unit 304
- 500 Salem St Unit 708
- 84 Fellsway E
- 38-40 Russell St
- 146 Avon St Unit 148
- 146 Avon St Unit 146 Avon #1
- 142 Avon St Unit 144
- 37 Quincy St
- 41 Quincy St
- 140 Avon St
- 26 Quincy St
- 26 Quincy St Unit 26
- 159 Myrtle St
- 31 Quincy St
- 24 Quincy St
- 39 Quincy St Unit R
- 39R Quincy St
- 1025 Fellsway Unit 7
- 1025 Fellsway Unit 3
- 1025 Fellsway Unit 5
- 1025 Fellsway Unit 4
- 1025 Fellsway Unit 2
- 1025 Fellsway Unit 6
- 1025 Fellsway Unit 1