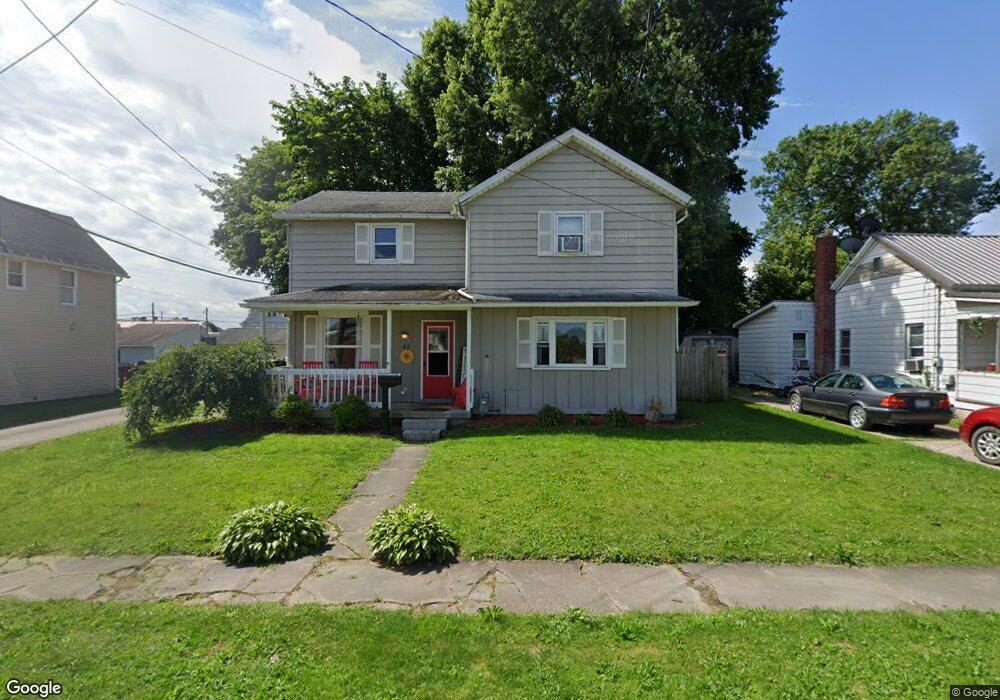
48 Raymond Ave Shelby, OH 44875
Estimated Value: $150,379 - $172,000
4
Beds
2
Baths
1,760
Sq Ft
$92/Sq Ft
Est. Value
About This Home
This home is located at 48 Raymond Ave, Shelby, OH 44875 and is currently estimated at $162,095, approximately $92 per square foot. 48 Raymond Ave is a home located in Richland County with nearby schools including St. Mary's School.
Ownership History
Date
Name
Owned For
Owner Type
Purchase Details
Closed on
Sep 6, 2011
Sold by
Shackle Scott D
Bought by
Shackle Scott D and Shackle Christy L
Current Estimated Value
Purchase Details
Closed on
Sep 27, 2007
Sold by
Reese Paul L
Bought by
Shackle Scott D
Home Financials for this Owner
Home Financials are based on the most recent Mortgage that was taken out on this home.
Original Mortgage
$85,458
Outstanding Balance
$54,601
Interest Rate
6.66%
Mortgage Type
FHA
Estimated Equity
$107,494
Purchase Details
Closed on
Jul 16, 1992
Sold by
Reese Paul L
Bought by
Reese Paul L
Create a Home Valuation Report for This Property
The Home Valuation Report is an in-depth analysis detailing your home's value as well as a comparison with similar homes in the area
Home Values in the Area
Average Home Value in this Area
Purchase History
| Date | Buyer | Sale Price | Title Company |
|---|---|---|---|
| Shackle Scott D | -- | Attorney | |
| Shackle Scott D | $86,800 | Southern Title | |
| Reese Paul L | -- | -- |
Source: Public Records
Mortgage History
| Date | Status | Borrower | Loan Amount |
|---|---|---|---|
| Open | Shackle Scott D | $85,458 |
Source: Public Records
Tax History Compared to Growth
Tax History
| Year | Tax Paid | Tax Assessment Tax Assessment Total Assessment is a certain percentage of the fair market value that is determined by local assessors to be the total taxable value of land and additions on the property. | Land | Improvement |
|---|---|---|---|---|
| 2024 | $1,291 | $33,790 | $5,300 | $28,490 |
| 2023 | $1,291 | $33,790 | $5,300 | $28,490 |
| 2022 | $1,267 | $29,660 | $5,370 | $24,290 |
| 2021 | $1,268 | $29,660 | $5,370 | $24,290 |
| 2020 | $1,269 | $29,660 | $5,370 | $24,290 |
| 2019 | $1,174 | $25,180 | $4,550 | $20,630 |
| 2018 | $1,163 | $25,180 | $4,550 | $20,630 |
| 2017 | $1,119 | $25,180 | $4,550 | $20,630 |
| 2016 | $1,086 | $23,890 | $4,320 | $19,570 |
| 2015 | $1,086 | $23,890 | $4,320 | $19,570 |
| 2014 | $1,043 | $23,890 | $4,320 | $19,570 |
| 2012 | $540 | $25,150 | $4,550 | $20,600 |
Source: Public Records
Map
Nearby Homes