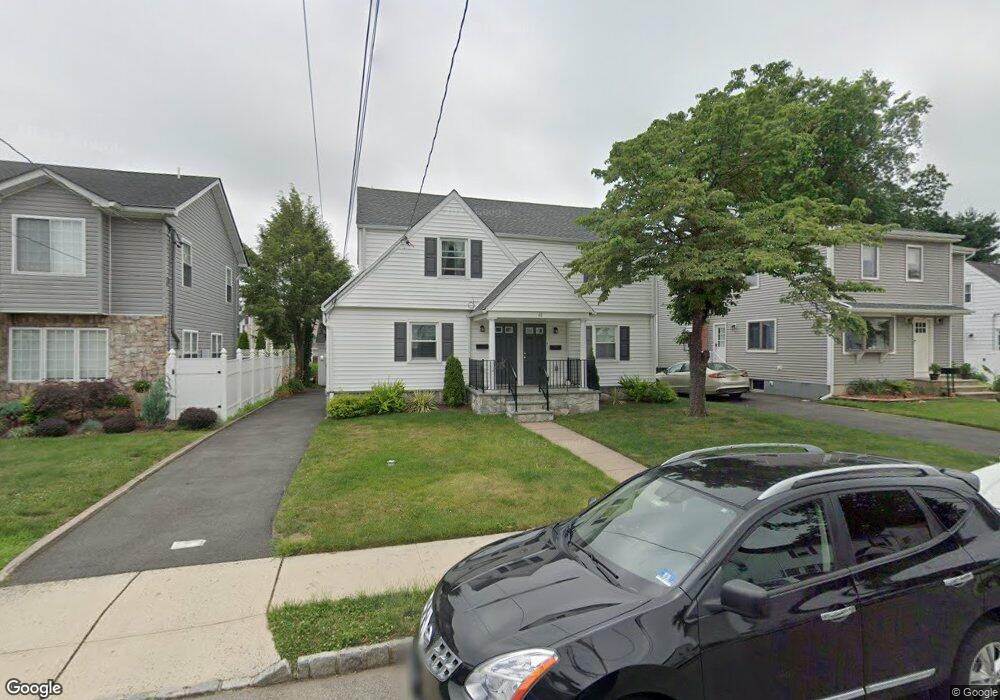
48 Reid Ave Bergenfield, NJ 07621
Estimated Value: $502,000 - $707,000
--
Bed
--
Bath
1,620
Sq Ft
$392/Sq Ft
Est. Value
About This Home
This home is located at 48 Reid Ave, Bergenfield, NJ 07621 and is currently estimated at $635,841, approximately $392 per square foot. 48 Reid Ave is a home located in Bergen County with nearby schools including Bergenfield High School and Institute For Educational Achievement.
Ownership History
Date
Name
Owned For
Owner Type
Purchase Details
Closed on
Nov 23, 2020
Sold by
Buschmann Gregg
Bought by
Callandrillo John and Callandrillo Gina
Current Estimated Value
Home Financials for this Owner
Home Financials are based on the most recent Mortgage that was taken out on this home.
Original Mortgage
$268,000
Interest Rate
2.6%
Mortgage Type
New Conventional
Purchase Details
Closed on
May 5, 2020
Sold by
Buschmann Gregg and Estate Of Fred J Buschmann
Bought by
Buschmann Greg
Create a Home Valuation Report for This Property
The Home Valuation Report is an in-depth analysis detailing your home's value as well as a comparison with similar homes in the area
Home Values in the Area
Average Home Value in this Area
Purchase History
| Date | Buyer | Sale Price | Title Company |
|---|---|---|---|
| Callandrillo John | $335,000 | None Available | |
| Buschmann Greg | -- | None Available |
Source: Public Records
Mortgage History
| Date | Status | Borrower | Loan Amount |
|---|---|---|---|
| Previous Owner | Callandrillo John | $268,000 |
Source: Public Records
Tax History Compared to Growth
Tax History
| Year | Tax Paid | Tax Assessment Tax Assessment Total Assessment is a certain percentage of the fair market value that is determined by local assessors to be the total taxable value of land and additions on the property. | Land | Improvement |
|---|---|---|---|---|
| 2025 | $10,803 | $306,300 | $162,400 | $143,900 |
| 2024 | $10,445 | $306,300 | $162,400 | $143,900 |
| 2023 | $10,282 | $306,300 | $162,400 | $143,900 |
| 2022 | $10,282 | $306,300 | $162,400 | $143,900 |
| 2021 | $9,742 | $306,300 | $162,400 | $143,900 |
| 2020 | $10,108 | $306,300 | $162,400 | $143,900 |
| 2019 | $9,992 | $306,300 | $162,400 | $143,900 |
| 2018 | $9,918 | $306,300 | $162,400 | $143,900 |
| 2017 | $9,869 | $306,300 | $162,400 | $143,900 |
| 2016 | $9,713 | $306,300 | $162,400 | $143,900 |
| 2015 | $9,313 | $306,300 | $162,400 | $143,900 |
| 2014 | $9,138 | $306,300 | $162,400 | $143,900 |
Source: Public Records
Map
Nearby Homes