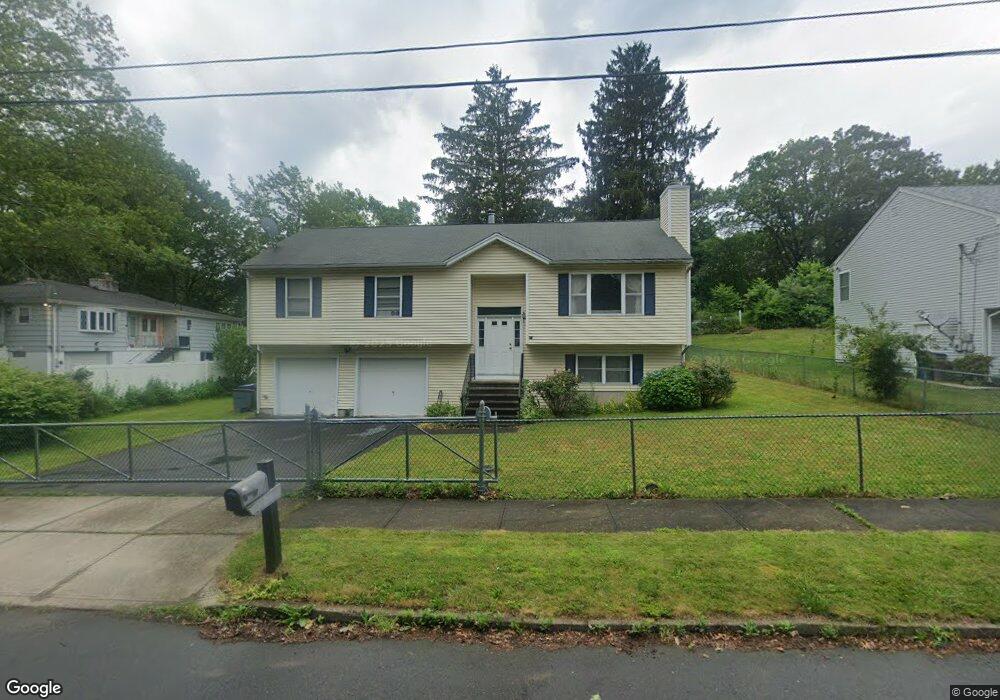
48 Rockdale Rd West Haven, CT 06516
Allingtown NeighborhoodEstimated Value: $400,000 - $453,416
3
Beds
3
Baths
1,488
Sq Ft
$283/Sq Ft
Est. Value
About This Home
This home is located at 48 Rockdale Rd, West Haven, CT 06516 and is currently estimated at $421,354, approximately $283 per square foot. 48 Rockdale Rd is a home located in New Haven County with nearby schools including Carrigan 5/6 Intermediate School, Harry M. Bailey Middle School, and West Haven High School.
Ownership History
Date
Name
Owned For
Owner Type
Purchase Details
Closed on
May 26, 2005
Sold by
Gaa Llc
Bought by
Wong Hok Ping and Gud Jin Jun
Current Estimated Value
Home Financials for this Owner
Home Financials are based on the most recent Mortgage that was taken out on this home.
Original Mortgage
$244,827
Interest Rate
5.94%
Mortgage Type
Purchase Money Mortgage
Create a Home Valuation Report for This Property
The Home Valuation Report is an in-depth analysis detailing your home's value as well as a comparison with similar homes in the area
Home Values in the Area
Average Home Value in this Area
Purchase History
| Date | Buyer | Sale Price | Title Company |
|---|---|---|---|
| Wong Hok Ping | $272,000 | -- | |
| Wong Hok Ping | $272,000 | -- |
Source: Public Records
Mortgage History
| Date | Status | Borrower | Loan Amount |
|---|---|---|---|
| Closed | Wong Hok Ping | $208,000 | |
| Closed | Wong Hok Ping | $244,827 |
Source: Public Records
Tax History Compared to Growth
Tax History
| Year | Tax Paid | Tax Assessment Tax Assessment Total Assessment is a certain percentage of the fair market value that is determined by local assessors to be the total taxable value of land and additions on the property. | Land | Improvement |
|---|---|---|---|---|
| 2025 | $9,413 | $276,780 | $69,300 | $207,480 |
| 2024 | $8,703 | $181,720 | $48,020 | $133,700 |
| 2023 | $8,435 | $181,720 | $48,020 | $133,700 |
| 2022 | $8,288 | $181,720 | $48,020 | $133,700 |
| 2021 | $8,290 | $181,720 | $48,020 | $133,700 |
| 2020 | $8,526 | $165,550 | $39,620 | $125,930 |
| 2019 | $8,393 | $165,550 | $39,620 | $125,930 |
| 2018 | $8,165 | $165,550 | $39,620 | $125,930 |
| 2017 | $7,910 | $165,550 | $39,620 | $125,930 |
| 2016 | $7,670 | $165,550 | $39,620 | $125,930 |
| 2015 | $7,839 | $192,640 | $42,210 | $150,430 |
| 2014 | $7,682 | $192,640 | $42,210 | $150,430 |
Source: Public Records
Map
Nearby Homes
- 60 Andrews St
- 38 Chauncey St
- 81 Homeside Ave
- 0 Burwell & Woodfield Rd Unit 24051262
- 0 Burwell Rd
- 35 Terrace Ave
- 104 Terrace Ave
- 194 Homeside Ave
- 14 Homestead Ave
- 78 Nonquit St
- 29 Birch St
- 63 Glade St Unit C1
- 1014 Campbell Ave Unit 14
- 100 Yates St
- 22 Bristol St
- 65 Westfield St
- 941 Campbell Ave
- 103 Gilbert St
- 161 W Spring St Unit B2
- 161 W Spring St Unit C1