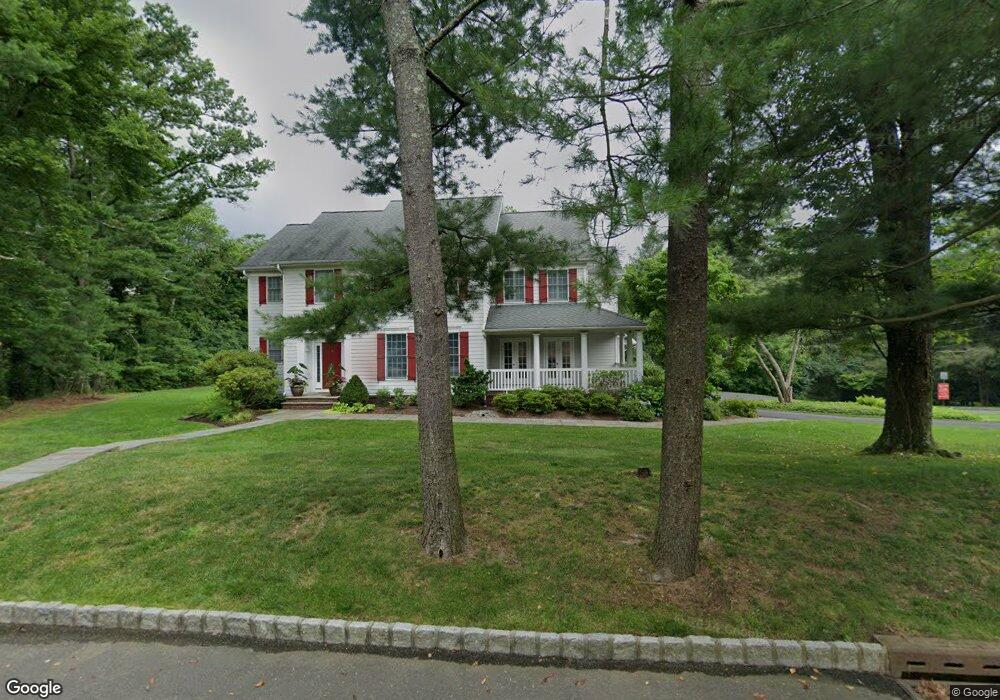
48 Roper Rd Princeton, NJ 08540
Estimated Value: $2,684,055 - $2,799,000
--
Bed
--
Bath
4,401
Sq Ft
$620/Sq Ft
Est. Value
About This Home
This home is located at 48 Roper Rd, Princeton, NJ 08540 and is currently estimated at $2,729,014, approximately $620 per square foot. 48 Roper Rd is a home located in Mercer County with nearby schools including Littlebrook Elementary School, Princeton Middle School, and Princeton High School.
Ownership History
Date
Name
Owned For
Owner Type
Purchase Details
Closed on
Dec 8, 2012
Sold by
Hait William N
Bought by
Hait Sung Yoo
Current Estimated Value
Purchase Details
Closed on
Nov 27, 2012
Sold by
Hait William N and Hait Sung
Bought by
Hait William N
Purchase Details
Closed on
Jun 12, 2002
Sold by
Dres Builders Llc
Bought by
Hait William and Hait Sung
Home Financials for this Owner
Home Financials are based on the most recent Mortgage that was taken out on this home.
Original Mortgage
$601,500
Interest Rate
6.92%
Purchase Details
Closed on
May 30, 2001
Sold by
Putnam Durinda
Bought by
Barsky Roman and Barsky Emma
Home Financials for this Owner
Home Financials are based on the most recent Mortgage that was taken out on this home.
Original Mortgage
$275,000
Interest Rate
7.09%
Create a Home Valuation Report for This Property
The Home Valuation Report is an in-depth analysis detailing your home's value as well as a comparison with similar homes in the area
Home Values in the Area
Average Home Value in this Area
Purchase History
| Date | Buyer | Sale Price | Title Company |
|---|---|---|---|
| Hait Sung Yoo | -- | None Available | |
| Hait William N | -- | None Available | |
| Hait William | $1,300,000 | -- | |
| Barsky Roman | $389,000 | -- |
Source: Public Records
Mortgage History
| Date | Status | Borrower | Loan Amount |
|---|---|---|---|
| Previous Owner | Hait William | $601,500 | |
| Previous Owner | Barsky Roman | $275,000 |
Source: Public Records
Tax History Compared to Growth
Tax History
| Year | Tax Paid | Tax Assessment Tax Assessment Total Assessment is a certain percentage of the fair market value that is determined by local assessors to be the total taxable value of land and additions on the property. | Land | Improvement |
|---|---|---|---|---|
| 2025 | $41,423 | $1,555,500 | $529,500 | $1,026,000 |
| 2024 | $39,105 | $1,555,500 | $529,500 | $1,026,000 |
| 2023 | $39,105 | $1,555,500 | $529,500 | $1,026,000 |
| 2022 | $37,830 | $1,555,500 | $529,500 | $1,026,000 |
| 2021 | $37,939 | $1,555,500 | $529,500 | $1,026,000 |
| 2020 | $40,429 | $1,670,600 | $583,500 | $1,087,100 |
| 2019 | $39,627 | $1,670,600 | $583,500 | $1,087,100 |
| 2018 | $38,958 | $1,670,600 | $583,500 | $1,087,100 |
| 2017 | $38,424 | $1,670,600 | $583,500 | $1,087,100 |
| 2016 | $37,822 | $1,670,600 | $583,500 | $1,087,100 |
| 2015 | $36,954 | $1,670,600 | $583,500 | $1,087,100 |
| 2014 | $36,503 | $1,670,600 | $583,500 | $1,087,100 |
Source: Public Records
Map
Nearby Homes
- 67 Locust Ln
- 569 Riverside Dr
- 567 Riverside Dr
- 532 Kingston Rd
- 50 Broadripple Dr
- 75 Clover Ln
- 32 Gulick Rd
- 119 Poe Rd
- 428 Nassau St
- 380 Franklin Ave
- 22 Gordon Way
- 1 Markham Rd Unit 2C
- 1 Markham Rd Unit 1D
- 150 Leabrook Ln
- 16 Cameron Ct
- 280 Sayre Dr
- 45 Hedge Row Rd
- 263 Sayre Dr
- 40 Dogwood Ln
- 1 Hedge Row Rd
- 25 White Pine Ln
- 76 Roper Rd
- 8 Random Rd
- 24 Roper Rd
- 7 Random Rd
- 18 White Pine Ln
- 35 White Pine Ln
- 26 White Pine Ln
- 70 Roper Rd
- 27 Roper Rd
- 41 Littlebrook Rd
- 43 White Pine Ln
- 34 White Pine Ln
- 23 Littlebrook Rd
- 17 Random Rd
- 26 Random Rd
- 19 Roper Rd
- 51 White Pine Ln
- 638 Princeton Kingston Rd
- 644 Kingston Rd