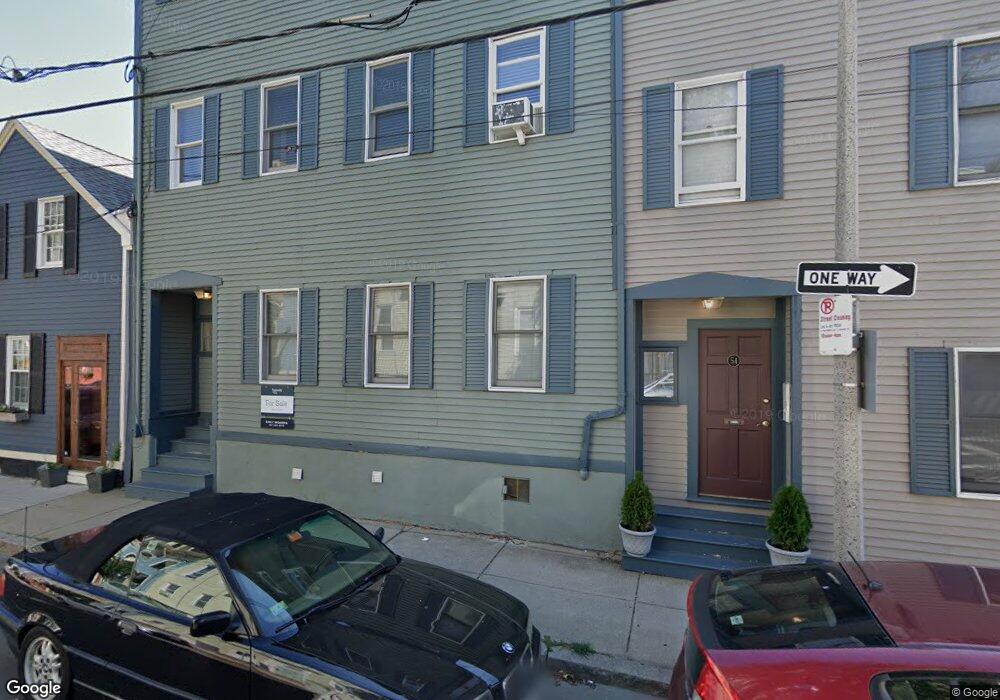
48 Russell St Unit 50 Charlestown, MA 02129
Medford Street-The Neck NeighborhoodEstimated Value: $667,739 - $752,000
2
Beds
1
Bath
694
Sq Ft
$1,020/Sq Ft
Est. Value
About This Home
This home is located at 48 Russell St Unit 50, Charlestown, MA 02129 and is currently estimated at $708,185, approximately $1,020 per square foot. 48 Russell St Unit 50 is a home located in Suffolk County with nearby schools including Prospect Hill Academy Upper Elementary Campus.
Ownership History
Date
Name
Owned For
Owner Type
Purchase Details
Closed on
Apr 28, 2023
Sold by
Brewer August and Aballo Jennifer
Bought by
Kokkalis George
Current Estimated Value
Home Financials for this Owner
Home Financials are based on the most recent Mortgage that was taken out on this home.
Original Mortgage
$674,500
Outstanding Balance
$655,053
Interest Rate
6.6%
Mortgage Type
Purchase Money Mortgage
Estimated Equity
$53,132
Purchase Details
Closed on
Oct 7, 2019
Sold by
Maslowski Kate
Bought by
Brewer August and Aballo Jennifer
Home Financials for this Owner
Home Financials are based on the most recent Mortgage that was taken out on this home.
Original Mortgage
$512,000
Interest Rate
3.5%
Mortgage Type
New Conventional
Purchase Details
Closed on
Jan 11, 2016
Sold by
Connelly Patrick and Connelly Jennifer
Bought by
Maslowski Kate
Home Financials for this Owner
Home Financials are based on the most recent Mortgage that was taken out on this home.
Original Mortgage
$360,000
Interest Rate
3.96%
Mortgage Type
New Conventional
Purchase Details
Closed on
Jul 21, 2006
Sold by
Shanahan Jason P
Bought by
Tierney Jennifer and Connelly Patrick
Home Financials for this Owner
Home Financials are based on the most recent Mortgage that was taken out on this home.
Original Mortgage
$54,000
Interest Rate
6.67%
Mortgage Type
Purchase Money Mortgage
Purchase Details
Closed on
Nov 14, 1990
Sold by
Higgins Thoms W
Bought by
Aronson Mrya J
Home Financials for this Owner
Home Financials are based on the most recent Mortgage that was taken out on this home.
Original Mortgage
$107,100
Interest Rate
10.03%
Mortgage Type
Purchase Money Mortgage
Create a Home Valuation Report for This Property
The Home Valuation Report is an in-depth analysis detailing your home's value as well as a comparison with similar homes in the area
Home Values in the Area
Average Home Value in this Area
Purchase History
| Date | Buyer | Sale Price | Title Company |
|---|---|---|---|
| Kokkalis George | $710,000 | None Available | |
| Brewer August | $640,000 | -- | |
| Maslowski Kate | $480,000 | -- | |
| Tierney Jennifer | $360,000 | -- | |
| Tierney Jennifer | $360,000 | -- | |
| Aronson Mrya J | $119,000 | -- |
Source: Public Records
Mortgage History
| Date | Status | Borrower | Loan Amount |
|---|---|---|---|
| Open | Kokkalis George | $674,500 | |
| Previous Owner | Brewer August | $512,000 | |
| Previous Owner | Maslowski Kate | $360,000 | |
| Previous Owner | Tierney Jennifer | $54,000 | |
| Previous Owner | Aronson Mrya J | $107,100 |
Source: Public Records
Tax History Compared to Growth
Tax History
| Year | Tax Paid | Tax Assessment Tax Assessment Total Assessment is a certain percentage of the fair market value that is determined by local assessors to be the total taxable value of land and additions on the property. | Land | Improvement |
|---|---|---|---|---|
| 2025 | $6,883 | $594,400 | $0 | $594,400 |
| 2024 | $6,066 | $556,500 | $0 | $556,500 |
| 2023 | $5,799 | $539,900 | $0 | $539,900 |
| 2022 | $5,649 | $519,200 | $0 | $519,200 |
| 2021 | $5,540 | $519,200 | $0 | $519,200 |
| 2020 | $4,783 | $452,900 | $0 | $452,900 |
| 2019 | $4,262 | $404,400 | $0 | $404,400 |
| 2018 | $4,035 | $385,000 | $0 | $385,000 |
| 2017 | $3,921 | $370,300 | $0 | $370,300 |
| 2016 | $3,845 | $349,500 | $0 | $349,500 |
| 2015 | $3,748 | $309,500 | $0 | $309,500 |
| 2014 | $3,571 | $283,900 | $0 | $283,900 |
Source: Public Records
Map
Nearby Homes
- 64 Walker St Unit 66
- 270 Bunker Hill St Unit 4
- 29 Eden St Unit 3
- 15 Russell St
- 9 Russell St Unit 2
- 9 Russell St Unit 1
- 255 Bunker Hill St Unit 2
- 247 Bunker Hill St Unit A
- 40 Mead St Unit 3
- 24 N Mead St
- 56 Belmont St Unit 1
- 364 Bunker Hill St Unit 1
- 207 Bunker Hill St Unit 2
- 9 Armory St
- 254-256 Medford St Unit 2
- 172 Bunker Hill St Unit 1
- 56 High St Unit 3
- 40 Chappie St Unit 1
- 46 High St
- 100 Baldwin St Unit 1
- 52 Russell St Unit 1B
- 48 Russell St Unit 50
- 48 Russell St Unit 50
- 52 Russell St Unit 54
- 52 Russell St Unit 54
- 52 Russell St Unit 54
- 48 Russell St Unit 3
- 54 Russell St Unit 2B
- 54 Russell St
- 52 Russell St Unit 2B
- 54 Russell St Unit 1
- 52 Russell St
- 48 Russell St
- 54 Russell St
- 48 Russell St Unit 3A
- 46 Russell St
- 44 Russell St
- 123 Bartlett St
- 121 Bartlett St
- 53 Walker St