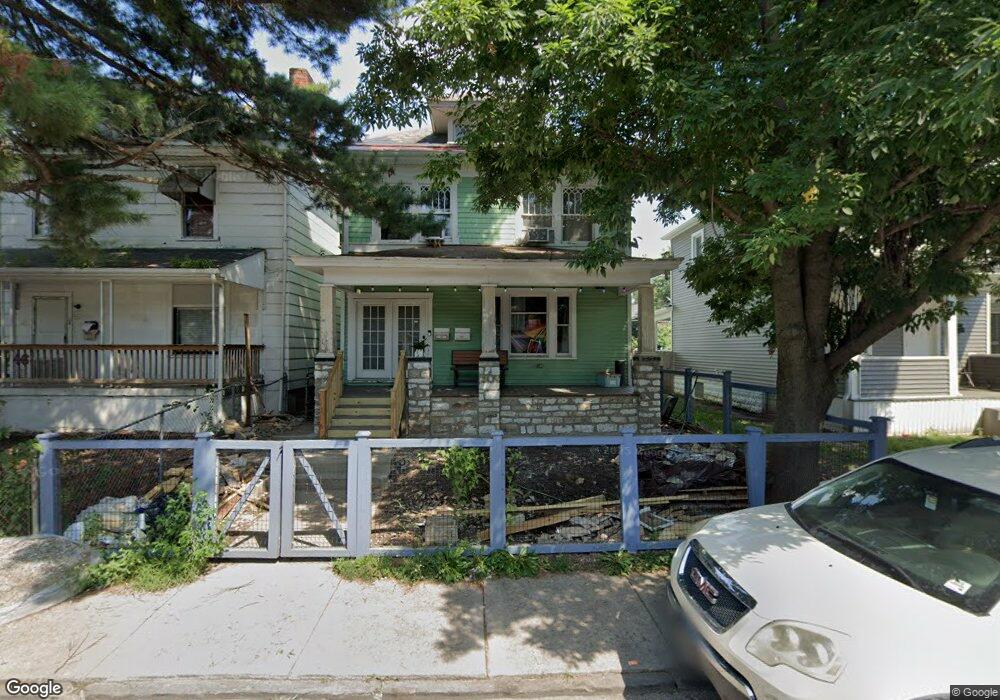
48 S Eureka Ave Unit 50 Columbus, OH 43204
Central Hilltop NeighborhoodEstimated Value: $134,000 - $170,000
About This Home
This home is located at 48 S Eureka Ave Unit 50, Columbus, OH 43204 and is currently estimated at $153,917, approximately $90 per square foot. 48 S Eureka Ave Unit 50 is a home located in Franklin County with nearby schools including Highland Elementary School, Westmoor Middle School, and West High School.
Ownership History
We collect this data history from publicly available records. To have your information removed, we recommend requesting removal directly through your county’s website.
Purchase Details
Home Financials for this Owner
Home Financials are based on the most recent Mortgage that was taken out on this home.Purchase Details
Purchase Details
Purchase Details
Purchase Details
Purchase Details
Purchase Details
Home Values in the Area
Average Home Value in this Area
Purchase History
We collect this data history from publicly available records. To have your information removed, we recommend requesting removal directly through your county’s website.
| Date | Buyer | Sale Price | Title Company |
|---|---|---|---|
| $87,000 | Atlas Title Solutions | ||
| -- | None Available | ||
| $74,900 | -- | ||
| $23,000 | -- | ||
| $41,735 | Independent Title | ||
| -- | Connor Title Co | ||
| $14,000 | -- |
Mortgage History
We collect this data history from publicly available records. To have your information removed, we recommend requesting removal directly through your county’s website.
| Date | Status | Borrower | Loan Amount |
|---|---|---|---|
| Open | $82,650 |
Tax History
We collect this data history from publicly available records. To have your information removed, we recommend requesting removal directly through your county’s website.
| Year | Tax Paid | Tax Assessment Tax Assessment Total Assessment is a certain percentage of the fair market value that is determined by local assessors to be the total taxable value of land and additions on the property. | Land | Improvement |
|---|---|---|---|---|
| 2025 | $2,088 | $46,520 | $5,360 | $41,160 |
| 2024 | $2,088 | $46,520 | $5,360 | $41,160 |
| 2023 | $2,061 | $46,515 | $5,355 | $41,160 |
| 2022 | $1,269 | $24,470 | $1,720 | $22,750 |
| 2021 | $1,271 | $24,470 | $1,720 | $22,750 |
| 2020 | $1,273 | $24,470 | $1,720 | $22,750 |
| 2019 | $1,219 | $20,100 | $1,440 | $18,660 |
| 2018 | $1,150 | $20,100 | $1,440 | $18,660 |
| 2017 | $1,206 | $20,100 | $1,440 | $18,660 |
| 2016 | $1,194 | $18,030 | $3,360 | $14,670 |
| 2015 | $1,084 | $18,030 | $3,360 | $14,670 |
| 2014 | $1,087 | $18,030 | $3,360 | $14,670 |
| 2013 | $631 | $21,210 | $3,955 | $17,255 |
Map
- 70 S Wayne Ave
- 95 S Eureka Ave
- 2380 Louden Ave
- 100 S Oakley Ave
- 151 S Wayne Ave Unit 153
- 155 S Wayne Ave
- 34 N Wayne Ave
- 66 S Wheatland Ave
- 179 S Eureka Ave
- 38 S Burgess Ave
- 90 S Burgess Ave
- 168 S Richardson Ave
- 89 N Wayne Ave
- 84 N Oakley Ave
- 152 S Burgess Ave
- 94 N Oakley Ave
- 120 N Eureka Ave Unit 122
- 126 Eldon Ave
- 137 S Burgess Ave
- 78 N Burgess Ave
- 52 S Eureka Ave
- 48 N Eureka Ave Unit 50
- 46 S Eureka Ave
- 52 N Eureka Ave
- 58 S Eureka Ave
- 40 N Eureka Ave
- 40 S Eureka Ave
- 62 S Eureka Ave Unit 64
- 62-64 S Eureka Ave
- 64 S Eureka Ave
- 34 S Eureka Ave
- 34 N Eureka Ave
- 51 S Wayne Ave
- 47 S Wayne Ave
- 70 S Eureka Ave Unit 72
- 70 S Eureka Ave Unit 70 & 72
- 55 S Wayne Ave Unit 57
- 70-72 S Eureka Ave
- 43 S Wayne Ave
- 30 S Eureka Ave
Ask me questions while you tour the home.