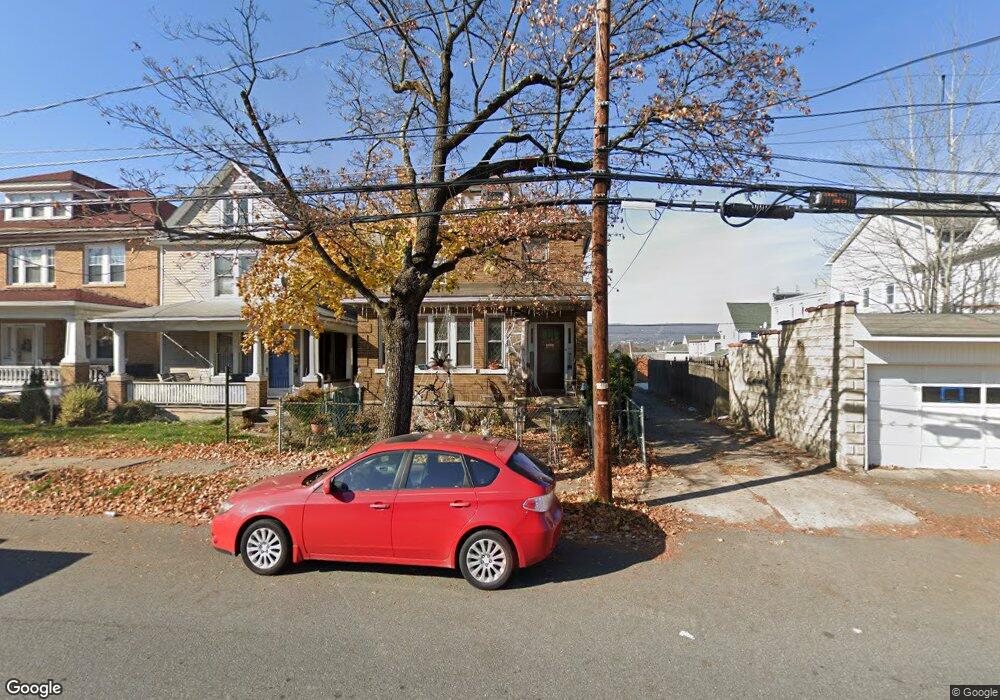
48 S Regent St Hanover Township, PA 18706
Estimated Value: $178,000 - $242,000
3
Beds
2
Baths
2,195
Sq Ft
$93/Sq Ft
Est. Value
About This Home
This home is located at 48 S Regent St, Hanover Township, PA 18706 and is currently estimated at $203,899, approximately $92 per square foot. 48 S Regent St is a home located in Luzerne County with nearby schools including Lee Park Elementary School, Hanover Area Memorial Elementary School, and Hanover Green Elementary School.
Ownership History
Date
Name
Owned For
Owner Type
Purchase Details
Closed on
Nov 30, 2019
Sold by
Makara Phillip B and Makara Linda A
Bought by
Valentine Robert John and Valentine Amy Lynn
Current Estimated Value
Home Financials for this Owner
Home Financials are based on the most recent Mortgage that was taken out on this home.
Original Mortgage
$108,105
Outstanding Balance
$95,589
Interest Rate
3.75%
Mortgage Type
FHA
Estimated Equity
$108,310
Purchase Details
Closed on
Nov 24, 1987
Bought by
Makara Phillip and Makara Linda
Create a Home Valuation Report for This Property
The Home Valuation Report is an in-depth analysis detailing your home's value as well as a comparison with similar homes in the area
Home Values in the Area
Average Home Value in this Area
Purchase History
| Date | Buyer | Sale Price | Title Company |
|---|---|---|---|
| Valentine Robert John | $110,100 | None Available | |
| Makara Phillip | $40,000 | -- |
Source: Public Records
Mortgage History
| Date | Status | Borrower | Loan Amount |
|---|---|---|---|
| Open | Valentine Robert John | $108,105 |
Source: Public Records
Tax History Compared to Growth
Tax History
| Year | Tax Paid | Tax Assessment Tax Assessment Total Assessment is a certain percentage of the fair market value that is determined by local assessors to be the total taxable value of land and additions on the property. | Land | Improvement |
|---|---|---|---|---|
| 2025 | $3,112 | $101,600 | $18,000 | $83,600 |
| 2024 | $3,112 | $101,600 | $18,000 | $83,600 |
| 2023 | $3,112 | $101,600 | $18,000 | $83,600 |
| 2022 | $3,093 | $101,600 | $18,000 | $83,600 |
| 2021 | $3,093 | $101,600 | $18,000 | $83,600 |
| 2020 | $3,093 | $101,600 | $18,000 | $83,600 |
| 2019 | $3,012 | $101,600 | $18,000 | $83,600 |
| 2018 | $2,952 | $101,600 | $18,000 | $83,600 |
| 2017 | $2,952 | $101,600 | $18,000 | $83,600 |
| 2016 | -- | $101,600 | $18,000 | $83,600 |
| 2015 | $2,505 | $101,600 | $18,000 | $83,600 |
| 2014 | $2,505 | $101,600 | $18,000 | $83,600 |
Source: Public Records
Map
Nearby Homes