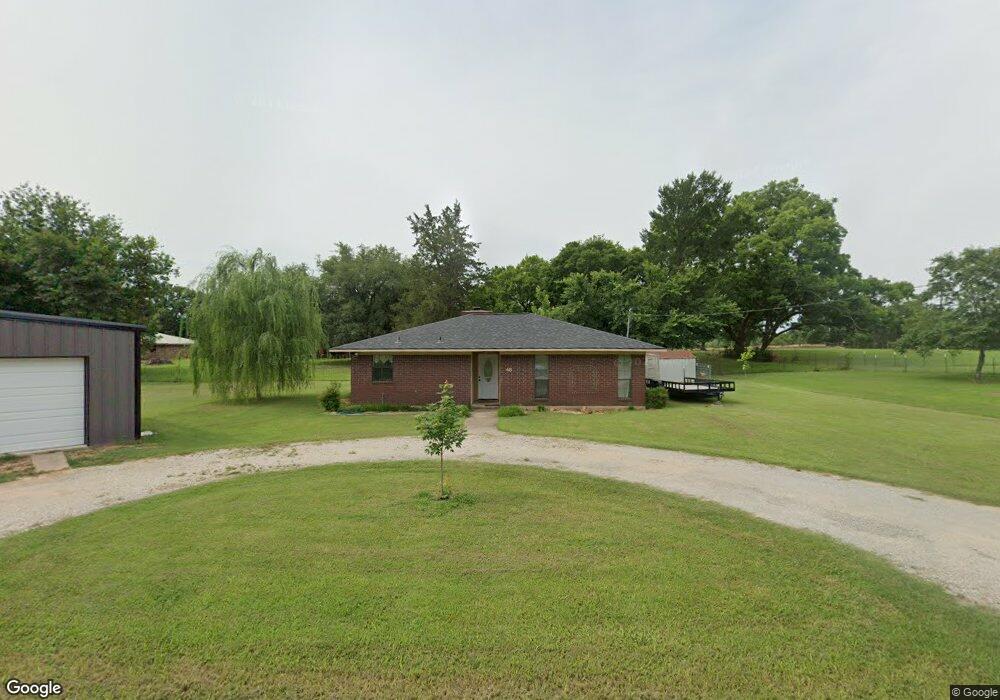
48 Sage Brush Ln Denison, TX 75021
Estimated Value: $204,387 - $255,000
2
Beds
2
Baths
1,188
Sq Ft
$193/Sq Ft
Est. Value
About This Home
This home is located at 48 Sage Brush Ln, Denison, TX 75021 and is currently estimated at $229,694, approximately $193 per square foot. 48 Sage Brush Ln is a home located in Grayson County with nearby schools including Lamar Elementary School, Scott Middle School, and Denison High School.
Ownership History
Date
Name
Owned For
Owner Type
Purchase Details
Closed on
Jul 26, 2019
Sold by
Camp Tammy and Reed Tammy
Bought by
Camp Joe W
Current Estimated Value
Purchase Details
Closed on
May 31, 2011
Sold by
Saunders Dana S and Saunders Billy
Bought by
Wells Fargo Bank Na
Home Financials for this Owner
Home Financials are based on the most recent Mortgage that was taken out on this home.
Original Mortgage
$73,575
Interest Rate
4.85%
Mortgage Type
New Conventional
Purchase Details
Closed on
Feb 17, 2005
Sold by
Donaldson Penny
Bought by
Hulstine Allen and Hulstine Susan
Home Financials for this Owner
Home Financials are based on the most recent Mortgage that was taken out on this home.
Original Mortgage
$64,600
Interest Rate
5.77%
Mortgage Type
Purchase Money Mortgage
Create a Home Valuation Report for This Property
The Home Valuation Report is an in-depth analysis detailing your home's value as well as a comparison with similar homes in the area
Home Values in the Area
Average Home Value in this Area
Purchase History
| Date | Buyer | Sale Price | Title Company |
|---|---|---|---|
| Camp Joe W | -- | None Available | |
| Wells Fargo Bank Na | $68,000 | None Available | |
| Saunders Dana S | -- | Security Title | |
| Hulstine Allen | -- | -- |
Source: Public Records
Mortgage History
| Date | Status | Borrower | Loan Amount |
|---|---|---|---|
| Previous Owner | Saunders Dana S | $73,575 | |
| Previous Owner | Hulstine Allen | $64,600 |
Source: Public Records
Tax History
| Year | Tax Paid | Tax Assessment Tax Assessment Total Assessment is a certain percentage of the fair market value that is determined by local assessors to be the total taxable value of land and additions on the property. | Land | Improvement |
|---|---|---|---|---|
| 2025 | $1,404 | $182,565 | -- | -- |
| 2024 | $2,680 | $165,968 | $0 | $0 |
| 2023 | $831 | $129,150 | $0 | $0 |
| 2022 | $2,029 | $117,409 | $0 | $0 |
| 2021 | $2,001 | $117,600 | $19,927 | $97,673 |
| 2020 | $1,932 | $97,032 | $15,227 | $81,805 |
| 2019 | $1,876 | $97,815 | $15,227 | $82,588 |
| 2018 | $1,723 | $80,287 | $15,227 | $65,060 |
| 2017 | $1,591 | $73,664 | $12,276 | $61,388 |
| 2016 | $1,522 | $79,652 | $12,053 | $67,599 |
Source: Public Records
Map
Nearby Homes
- 40 Sheryl Ln
- 227 Sheryl Ln
- 513 Joy Ln
- 516 Forrest Ln
- 1747 Desvoignes Rd
- 413 Rolling Acres Rd
- 905 Seymore Cir
- 2931 S Barrett Ave
- 3101 S College Blvd
- 246 Karen Dr
- 711 Dubois St
- 618 Star St
- 3312 Vine Ln
- 905 Thatcher St
- 907 Thatcher St
- 819 Dubois St
- 901 Dubois St
- 701 W Star St
- 603 W Star St
- 2526 S Fannin Ave Unit 2600
- 16 Sage Brush Ln
- 87 Jade Ln
- 45 Sage Brush Ln
- 45 Sage Brush Ln
- 98 Jade Ln
- 144 Sage Brush Ln
- 115 Sage Brush Ln
- LOT 1R-1 S Fannin St
- LOT 1R-4 S Fannin St
- LOT 1R-3 S Fannin St
- LOT 1R-5 S Fannin St
- LOT 1R-2 S Fannin St
- 5024 S Fannin St
- 168 Sage Brush Ln
- 3845 S Fannin Ave
- 33 Sheryl Ln
- 3575 S Fannin Ave
- 121 Sheryl Ln
- 39 Sheryl Ln
- 3525 S Fannin St
Your Personal Tour Guide
Ask me questions while you tour the home.