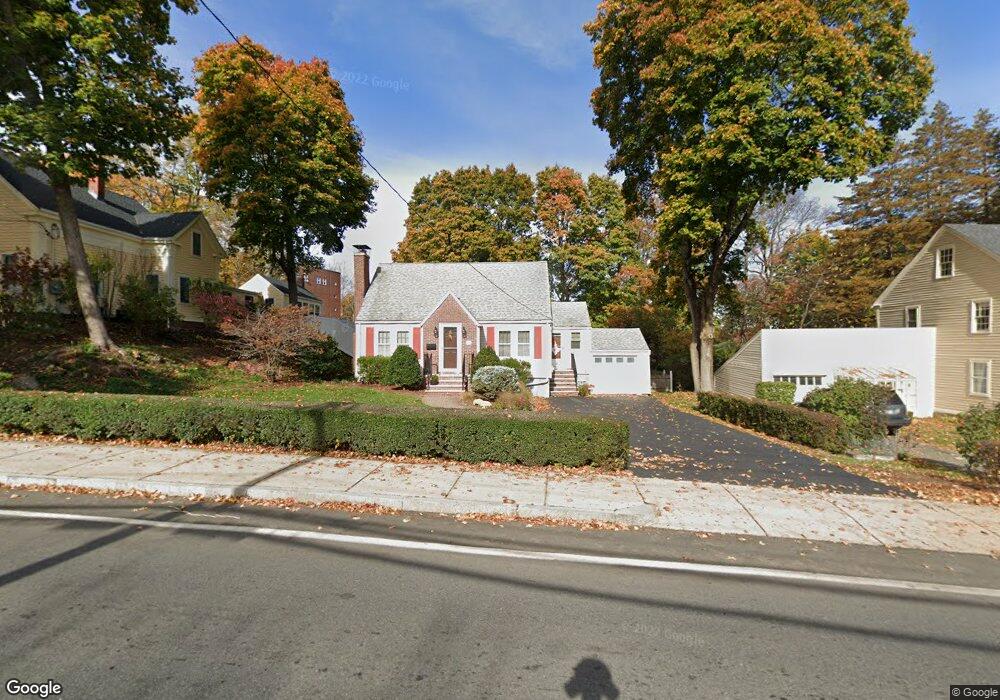
48 Salem St Reading, MA 01867
Estimated Value: $723,181 - $824,000
3
Beds
1
Bath
1,556
Sq Ft
$489/Sq Ft
Est. Value
About This Home
This home is located at 48 Salem St, Reading, MA 01867 and is currently estimated at $761,545, approximately $489 per square foot. 48 Salem St is a home located in Middlesex County with nearby schools including J. Warren Killam Elementary School, Walter S. Parker Middle School, and Reading Memorial High School.
Ownership History
Date
Name
Owned For
Owner Type
Purchase Details
Closed on
Dec 5, 2017
Sold by
Scott John R and Scott Mary
Bought by
Scott
Current Estimated Value
Purchase Details
Closed on
Oct 19, 1987
Sold by
Lamontagne Henry C
Bought by
Scott John R
Home Financials for this Owner
Home Financials are based on the most recent Mortgage that was taken out on this home.
Original Mortgage
$107,000
Interest Rate
10.63%
Mortgage Type
Purchase Money Mortgage
Create a Home Valuation Report for This Property
The Home Valuation Report is an in-depth analysis detailing your home's value as well as a comparison with similar homes in the area
Home Values in the Area
Average Home Value in this Area
Purchase History
| Date | Buyer | Sale Price | Title Company |
|---|---|---|---|
| Scott | -- | -- | |
| Scott John R | $171,000 | -- |
Source: Public Records
Mortgage History
| Date | Status | Borrower | Loan Amount |
|---|---|---|---|
| Previous Owner | Scott John R | $103,500 | |
| Previous Owner | Scott John R | $107,000 |
Source: Public Records
Tax History Compared to Growth
Tax History
| Year | Tax Paid | Tax Assessment Tax Assessment Total Assessment is a certain percentage of the fair market value that is determined by local assessors to be the total taxable value of land and additions on the property. | Land | Improvement |
|---|---|---|---|---|
| 2025 | $7,034 | $617,600 | $373,000 | $244,600 |
| 2024 | $7,095 | $605,400 | $365,600 | $239,800 |
| 2023 | $6,801 | $540,200 | $326,200 | $214,000 |
| 2022 | $6,458 | $484,500 | $292,500 | $192,000 |
| 2021 | $6,054 | $438,400 | $254,100 | $184,300 |
| 2020 | $5,859 | $420,000 | $243,400 | $176,600 |
| 2019 | $5,689 | $399,800 | $231,700 | $168,100 |
| 2018 | $5,443 | $392,400 | $227,400 | $165,000 |
| 2017 | $5,170 | $368,500 | $213,500 | $155,000 |
| 2016 | $4,966 | $342,500 | $212,700 | $129,800 |
| 2015 | $4,717 | $320,900 | $199,300 | $121,600 |
| 2014 | $4,549 | $308,600 | $191,600 | $117,000 |
Source: Public Records
Map
Nearby Homes
- 52 Salem St
- 52 Sanborn St Unit 408
- 48 Village St Unit 1001
- 863 Main St
- 169 Green St
- 223 Washington St
- 41 Winter St
- 77 Mount Vernon St
- 103 High St
- 5 Washington St Unit B2
- 42 Winthrop Ave
- 24 Minot St
- 35 Park Ave
- 195 Lowell St
- 23 Governors Dr
- 36 Bay State Rd
- 10 Line Rd Unit A
- 237 Main St Unit A4
- 50 Quannapowitt Pkwy
- 101 King St Unit 101
- 42 Salem St
- 52 Salem St Unit 2
- 38 Salem St Unit A
- 38 Salem St Unit B
- 38 Salem St Unit 2
- 38 Salem St Unit 1
- 38 B Salem St Unit 2
- 38 A Salem St Unit 38A
- 38 B Salem St Unit 38B
- 51-53 Salem Street - 1
- 49 Salem St
- 6 John St
- 51 Salem St
- 51 Salem St Unit 2nd flr
- 51 Salem St Unit 2
- 34 Salem St Unit 201
- 37 Salem St
- 37 Salem St Unit 1
- 37 Salem St Unit 2
- 58 Salem St Unit 58