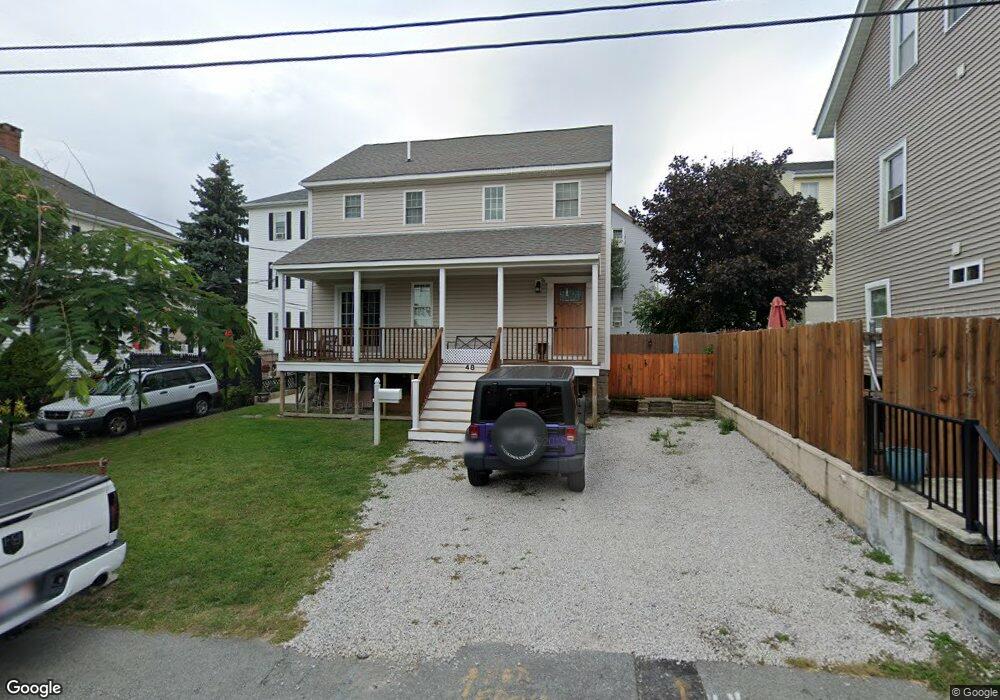
48 Saucier St Fall River, MA 02724
Father Kelly NeighborhoodEstimated Value: $316,000 - $406,000
3
Beds
2
Baths
1,380
Sq Ft
$260/Sq Ft
Est. Value
About This Home
This home is located at 48 Saucier St, Fall River, MA 02724 and is currently estimated at $359,389, approximately $260 per square foot. 48 Saucier St is a home located in Bristol County with nearby schools including Carlton M. Viveiros Elementary School, Matthew J. Kuss Middle School, and B M C Durfee High School.
Ownership History
Date
Name
Owned For
Owner Type
Purchase Details
Closed on
May 26, 2005
Sold by
Department Of Housing & Urban Dev
Bought by
Pinheiro Marcia and Pinheiro Renato P
Current Estimated Value
Home Financials for this Owner
Home Financials are based on the most recent Mortgage that was taken out on this home.
Original Mortgage
$142,500
Outstanding Balance
$75,254
Interest Rate
5.94%
Mortgage Type
Purchase Money Mortgage
Estimated Equity
$284,135
Purchase Details
Closed on
Mar 2, 2005
Sold by
Washington Mutual Bank
Bought by
Department Of Housing & Urban Dev
Purchase Details
Closed on
Sep 15, 2003
Sold by
Jackson Clifford H
Bought by
Washington Mutual Bk
Purchase Details
Closed on
Nov 12, 1997
Sold by
Wamsutta Rt and Boyer
Bought by
Jackson Clifford H and Jackson Mary Sue
Home Financials for this Owner
Home Financials are based on the most recent Mortgage that was taken out on this home.
Original Mortgage
$89,300
Interest Rate
7.23%
Mortgage Type
Purchase Money Mortgage
Create a Home Valuation Report for This Property
The Home Valuation Report is an in-depth analysis detailing your home's value as well as a comparison with similar homes in the area
Home Values in the Area
Average Home Value in this Area
Purchase History
| Date | Buyer | Sale Price | Title Company |
|---|---|---|---|
| Pinheiro Marcia | $150,000 | -- | |
| Department Of Housing & Urban Dev | -- | -- | |
| Washington Mutual Bk | $104,173 | -- | |
| Jackson Clifford H | $89,000 | -- | |
| Wamsutta Rt | $56,000 | -- |
Source: Public Records
Mortgage History
| Date | Status | Borrower | Loan Amount |
|---|---|---|---|
| Open | Pinheiro Marcia | $142,500 | |
| Previous Owner | Wamsutta Rt | $89,300 | |
| Closed | Wamsutta Rt | $41,000 |
Source: Public Records
Tax History
| Year | Tax Paid | Tax Assessment Tax Assessment Total Assessment is a certain percentage of the fair market value that is determined by local assessors to be the total taxable value of land and additions on the property. | Land | Improvement |
|---|---|---|---|---|
| 2025 | $2,964 | $258,900 | $105,400 | $153,500 |
| 2024 | $2,785 | $242,400 | $101,500 | $140,900 |
| 2023 | $2,659 | $216,700 | $83,900 | $132,800 |
| 2022 | $2,398 | $190,000 | $79,900 | $110,100 |
| 2021 | $2,354 | $170,200 | $76,000 | $94,200 |
| 2020 | $2,354 | $162,900 | $74,900 | $88,000 |
| 2019 | $2,277 | $156,200 | $72,100 | $84,100 |
| 2018 | $2,270 | $155,300 | $78,100 | $77,200 |
| 2017 | $2,104 | $150,300 | $74,500 | $75,800 |
| 2016 | $2,049 | $150,300 | $79,200 | $71,100 |
| 2015 | $1,865 | $142,600 | $79,200 | $63,400 |
| 2014 | $1,765 | $140,300 | $76,900 | $63,400 |
Source: Public Records
Map
Nearby Homes
- 1334 S Main St
- 1273-1279 S Main St
- 344-354 E Main St
- 219 Montaup St
- 240 Montaup St
- 71 Mystic St Unit 3
- 82 Montaup St
- 20 Wilcox St
- 917 Dwelly St
- 234 Kilburn St
- 340 Vale St
- 355 Peckham St
- 70 Brown St
- 1846 S Main St
- 119 Pebble St
- 1852 S Main St
- 609 King Philip St
- 57 Larouche St
- 250 Laurel St
- 464 Birch St
Your Personal Tour Guide
Ask me questions while you tour the home.