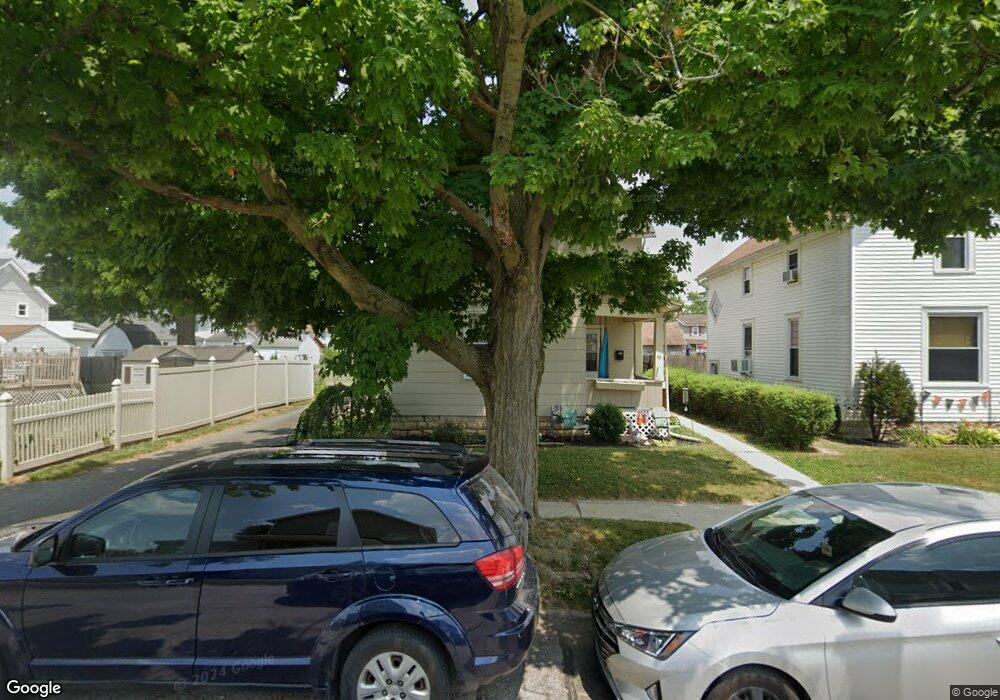
48 Scott St Tiffin, OH 44883
Estimated Value: $118,000 - $176,000
4
Beds
2
Baths
1,736
Sq Ft
$85/Sq Ft
Est. Value
About This Home
This home is located at 48 Scott St, Tiffin, OH 44883 and is currently estimated at $146,838, approximately $84 per square foot. 48 Scott St is a home located in Seneca County with nearby schools including Columbian High School and Calvert High School.
Ownership History
Date
Name
Owned For
Owner Type
Purchase Details
Closed on
Nov 1, 2010
Sold by
Hsbc Mortgage Services Inc
Bought by
R Investments Llc
Current Estimated Value
Home Financials for this Owner
Home Financials are based on the most recent Mortgage that was taken out on this home.
Original Mortgage
$32,650
Outstanding Balance
$21,162
Interest Rate
4.31%
Mortgage Type
Commercial
Estimated Equity
$125,676
Purchase Details
Closed on
Sep 20, 2010
Sold by
Conrad April
Bought by
Hsbc Mortgage Servies Inc
Home Financials for this Owner
Home Financials are based on the most recent Mortgage that was taken out on this home.
Original Mortgage
$32,650
Outstanding Balance
$21,162
Interest Rate
4.31%
Mortgage Type
Commercial
Estimated Equity
$125,676
Purchase Details
Closed on
Dec 21, 2004
Sold by
Bernard Marguerite O
Bought by
Conrad April
Purchase Details
Closed on
Oct 4, 1996
Sold by
Bernard Marguerite O
Bought by
Bernard Marguerite O
Purchase Details
Closed on
Jun 17, 1991
Sold by
Granata Joseph A
Bought by
Bernard Marguerite O
Create a Home Valuation Report for This Property
The Home Valuation Report is an in-depth analysis detailing your home's value as well as a comparison with similar homes in the area
Home Values in the Area
Average Home Value in this Area
Purchase History
| Date | Buyer | Sale Price | Title Company |
|---|---|---|---|
| R Investments Llc | $26,200 | None Available | |
| Hsbc Mortgage Servies Inc | $43,334 | None Available | |
| Conrad April | $75,000 | -- | |
| Bernard Marguerite O | $58,000 | -- | |
| Bernard Marguerite O | $54,000 | -- |
Source: Public Records
Mortgage History
| Date | Status | Borrower | Loan Amount |
|---|---|---|---|
| Open | R Investments Llc | $32,650 |
Source: Public Records
Tax History
| Year | Tax Paid | Tax Assessment Tax Assessment Total Assessment is a certain percentage of the fair market value that is determined by local assessors to be the total taxable value of land and additions on the property. | Land | Improvement |
|---|---|---|---|---|
| 2025 | $1,321 | $38,030 | $3,840 | $34,190 |
| 2024 | $1,315 | $38,030 | $3,840 | $34,190 |
| 2023 | $1,316 | $38,030 | $3,840 | $34,190 |
| 2022 | $1,157 | $27,740 | $3,340 | $24,400 |
| 2021 | $1,165 | $27,740 | $3,340 | $24,400 |
| 2020 | $1,187 | $27,738 | $3,339 | $24,399 |
| 2019 | $1,148 | $25,950 | $3,203 | $22,747 |
| 2018 | $1,151 | $25,950 | $3,203 | $22,747 |
| 2017 | $1,163 | $25,950 | $3,203 | $22,747 |
| 2016 | $1,052 | $24,028 | $3,108 | $20,920 |
| 2015 | $1,041 | $24,028 | $3,108 | $20,920 |
| 2014 | $982 | $24,028 | $3,108 | $20,920 |
| 2013 | $1,049 | $24,760 | $3,203 | $21,557 |
Source: Public Records
Map
Nearby Homes
- 109 Wall St
- 109 -111 Wall St
- 127 Wentz St
- 2695 Ohio 18
- 311 W Perry St
- 191 Wentz St
- 0 Miami St Unit 10003054
- 0 Miami St Unit Parcel 2
- 0 Miami St Unit 20260131
- 376 W Perry St
- 314 S Sandusky St
- 335 Benner St
- 0 W Tr 198a Unit 20260135
- 0 Township Road 198a Unit Parcel 4
- 0 Township Road 198a Unit 10003057
- 96 Lindsay Ave
- 241 Hall St
- 66 N Sandusky St
- 49 2nd St
- 426 Wall St
Your Personal Tour Guide
Ask me questions while you tour the home.