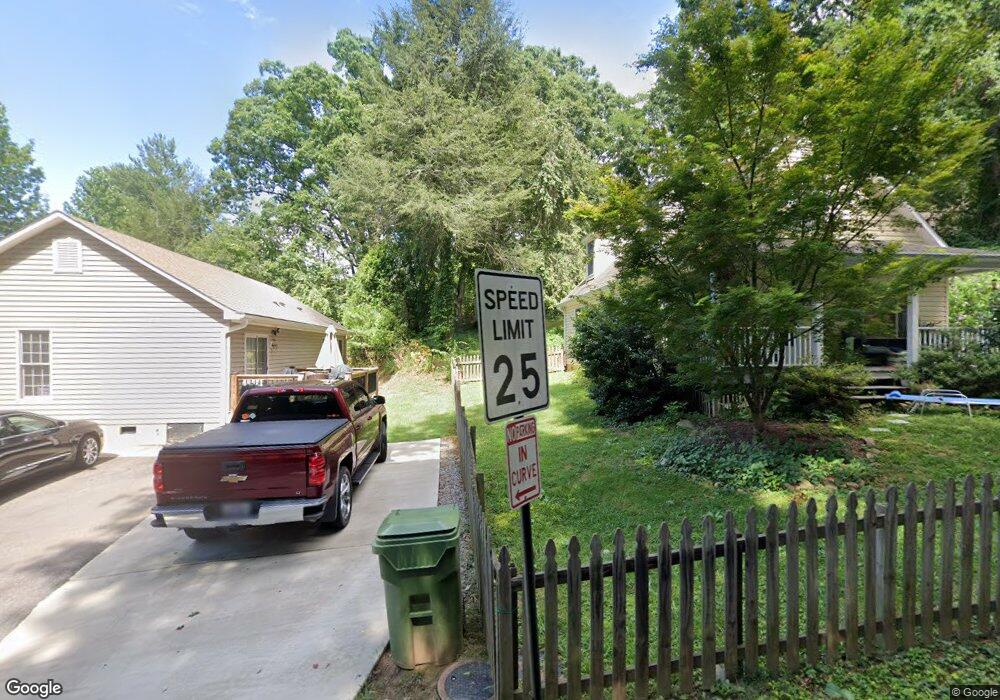
48 Shady Oak Dr Asheville, NC 28803
Estimated Value: $319,090 - $401,000
3
Beds
2
Baths
1,275
Sq Ft
$290/Sq Ft
Est. Value
About This Home
This home is located at 48 Shady Oak Dr, Asheville, NC 28803 and is currently estimated at $369,523, approximately $289 per square foot. 48 Shady Oak Dr is a home located in Buncombe County with nearby schools including T.C. Roberson High School, William W. Estes Elementary School, and Koontz Intermediate School.
Ownership History
Date
Name
Owned For
Owner Type
Purchase Details
Closed on
Aug 17, 2007
Sold by
Haddas Virginia and Estate Of Aaron Haddas
Bought by
Floyd Amy Elizabeth and Floyd David Benjamin
Current Estimated Value
Home Financials for this Owner
Home Financials are based on the most recent Mortgage that was taken out on this home.
Original Mortgage
$159,300
Outstanding Balance
$100,344
Interest Rate
6.56%
Mortgage Type
Purchase Money Mortgage
Estimated Equity
$269,179
Purchase Details
Closed on
Mar 7, 2006
Sold by
Haddas Virginia
Bought by
Haddas Aaron
Purchase Details
Closed on
Jan 30, 2004
Sold by
Jewell Properties Llc
Bought by
Haddas Aaron M and Haddas Virginia C
Home Financials for this Owner
Home Financials are based on the most recent Mortgage that was taken out on this home.
Original Mortgage
$133,500
Interest Rate
5.25%
Mortgage Type
Purchase Money Mortgage
Create a Home Valuation Report for This Property
The Home Valuation Report is an in-depth analysis detailing your home's value as well as a comparison with similar homes in the area
Home Values in the Area
Average Home Value in this Area
Purchase History
| Date | Buyer | Sale Price | Title Company |
|---|---|---|---|
| Floyd Amy Elizabeth | $177,000 | None Available | |
| Haddas Aaron | -- | None Available | |
| Haddas Aaron M | $133,500 | -- |
Source: Public Records
Mortgage History
| Date | Status | Borrower | Loan Amount |
|---|---|---|---|
| Open | Floyd Amy Elizabeth | $159,300 | |
| Closed | Floyd Amy Elizabeth | $17,700 | |
| Previous Owner | Haddas Aaron M | $133,500 |
Source: Public Records
Tax History Compared to Growth
Tax History
| Year | Tax Paid | Tax Assessment Tax Assessment Total Assessment is a certain percentage of the fair market value that is determined by local assessors to be the total taxable value of land and additions on the property. | Land | Improvement |
|---|---|---|---|---|
| 2025 | $2,604 | $279,900 | $50,600 | $229,300 |
| 2024 | $2,604 | $279,900 | $50,600 | $229,300 |
| 2023 | $2,604 | $279,900 | $50,600 | $229,300 |
| 2022 | $2,494 | $279,900 | $0 | $0 |
| 2021 | $2,494 | $279,900 | $0 | $0 |
| 2020 | $2,154 | $224,900 | $0 | $0 |
| 2019 | $2,154 | $224,900 | $0 | $0 |
| 2018 | $2,154 | $224,900 | $0 | $0 |
| 2017 | $2,177 | $156,500 | $0 | $0 |
| 2016 | $1,689 | $156,500 | $0 | $0 |
| 2015 | $1,689 | $156,500 | $0 | $0 |
| 2014 | $1,665 | $156,500 | $0 | $0 |
Source: Public Records
Map
Nearby Homes