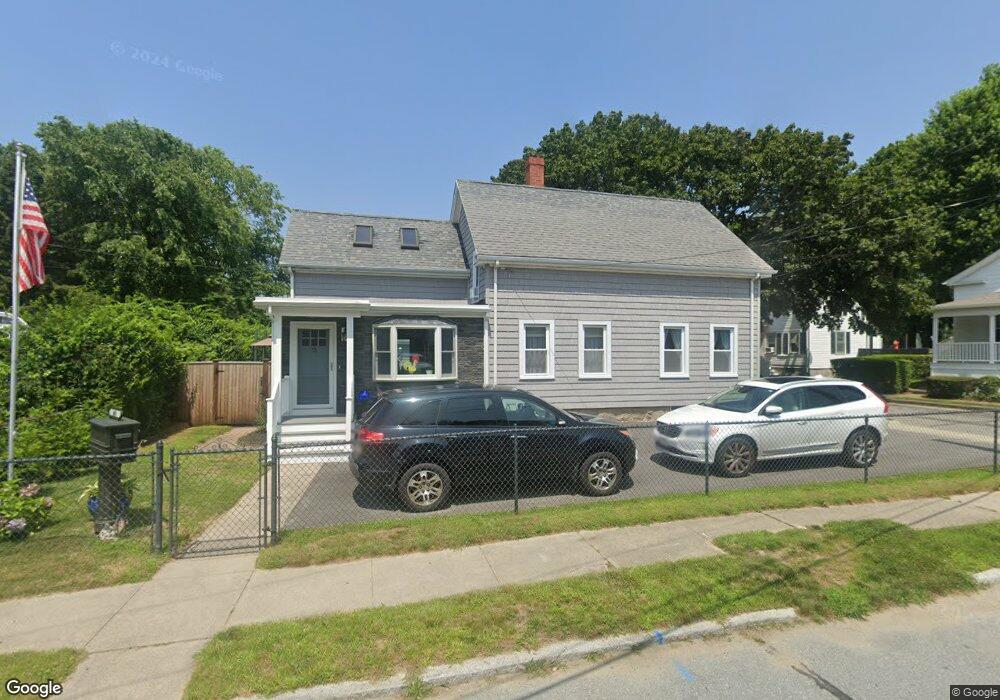
48 Spring St Fairhaven, MA 02719
Estimated Value: $451,377 - $473,000
3
Beds
3
Baths
1,409
Sq Ft
$327/Sq Ft
Est. Value
About This Home
This home is located at 48 Spring St, Fairhaven, MA 02719 and is currently estimated at $460,594, approximately $326 per square foot. 48 Spring St is a home located in Bristol County with nearby schools including Fairhaven High School, City On A Hill Charter Public School New Bedford, and St. Joseph School.
Ownership History
Date
Name
Owned For
Owner Type
Purchase Details
Closed on
Mar 21, 2005
Sold by
Jabotte Karen L and Medeiros Karen L
Bought by
Medeiros Karen L and Medeiros Michael J
Current Estimated Value
Purchase Details
Closed on
May 28, 1965
Bought by
Medeiros Michael J and Medeiros Karen L
Create a Home Valuation Report for This Property
The Home Valuation Report is an in-depth analysis detailing your home's value as well as a comparison with similar homes in the area
Home Values in the Area
Average Home Value in this Area
Purchase History
| Date | Buyer | Sale Price | Title Company |
|---|---|---|---|
| Medeiros Karen L | -- | -- | |
| Medeiros Michael J | -- | -- |
Source: Public Records
Mortgage History
| Date | Status | Borrower | Loan Amount |
|---|---|---|---|
| Open | Medeiros Michael J | $249,224 | |
| Closed | Medeiros Michael J | $262,922 | |
| Closed | Medeiros Michael J | $83,200 |
Source: Public Records
Tax History
| Year | Tax Paid | Tax Assessment Tax Assessment Total Assessment is a certain percentage of the fair market value that is determined by local assessors to be the total taxable value of land and additions on the property. | Land | Improvement |
|---|---|---|---|---|
| 2025 | $35 | $378,700 | $170,400 | $208,300 |
| 2024 | $3,430 | $371,600 | $170,400 | $201,200 |
| 2023 | $3,368 | $338,500 | $149,200 | $189,300 |
| 2022 | $3,278 | $320,700 | $138,700 | $182,000 |
| 2021 | $3,135 | $277,700 | $125,500 | $152,200 |
| 2020 | $3,071 | $277,700 | $125,500 | $152,200 |
| 2019 | $5,063 | $244,900 | $104,100 | $140,800 |
| 2018 | $2,738 | $233,000 | $99,100 | $133,900 |
| 2017 | $2,697 | $224,000 | $99,100 | $124,900 |
| 2016 | $2,608 | $214,100 | $99,100 | $115,000 |
| 2015 | $2,553 | $210,100 | $99,100 | $111,000 |
Source: Public Records
Map
Nearby Homes
Your Personal Tour Guide
Ask me questions while you tour the home.