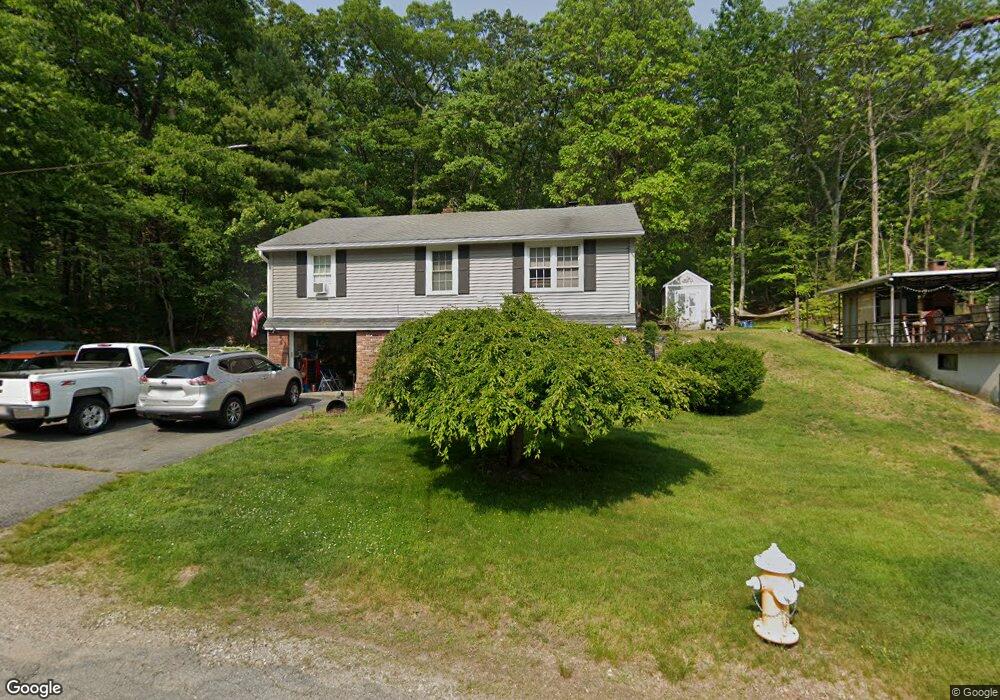
48 Spring St Unit 50 Whitinsville, MA 01588
Estimated Value: $479,249 - $522,000
3
Beds
2
Baths
1,169
Sq Ft
$426/Sq Ft
Est. Value
About This Home
This home is located at 48 Spring St Unit 50, Whitinsville, MA 01588 and is currently estimated at $497,562, approximately $425 per square foot. 48 Spring St Unit 50 is a home located in Worcester County with nearby schools including Northbridge Elementary School, Northbridge Middle School, and Northbridge High School.
Ownership History
Date
Name
Owned For
Owner Type
Purchase Details
Closed on
Jun 4, 2008
Sold by
Bedard Omerthea
Bought by
Manzo Anthony S and Bedard Omerthea
Current Estimated Value
Home Financials for this Owner
Home Financials are based on the most recent Mortgage that was taken out on this home.
Original Mortgage
$257,962
Interest Rate
6.11%
Mortgage Type
Purchase Money Mortgage
Purchase Details
Closed on
Feb 16, 2007
Sold by
Bol Kelly A and Bol Nicholas P
Bought by
Bedard Omerthea
Purchase Details
Closed on
Aug 1, 2001
Sold by
Nydam James G and Nydam Jean S
Bought by
Bol Nicholas P and Sullivan Kelly A
Create a Home Valuation Report for This Property
The Home Valuation Report is an in-depth analysis detailing your home's value as well as a comparison with similar homes in the area
Home Values in the Area
Average Home Value in this Area
Purchase History
| Date | Buyer | Sale Price | Title Company |
|---|---|---|---|
| Manzo Anthony S | -- | -- | |
| Manzo Anthony S | -- | -- | |
| Manzo Anthony S | -- | -- | |
| Bedard Omerthea | $249,999 | -- | |
| Bedard Omerthea | $249,999 | -- | |
| Bol Nicholas P | $105,000 | -- | |
| Bol Nicholas P | $105,000 | -- |
Source: Public Records
Mortgage History
| Date | Status | Borrower | Loan Amount |
|---|---|---|---|
| Open | Bol Nicholas P | $257,962 | |
| Closed | Manzo Anthony S | $257,962 |
Source: Public Records
Tax History Compared to Growth
Tax History
| Year | Tax Paid | Tax Assessment Tax Assessment Total Assessment is a certain percentage of the fair market value that is determined by local assessors to be the total taxable value of land and additions on the property. | Land | Improvement |
|---|---|---|---|---|
| 2025 | $4,748 | $402,700 | $126,500 | $276,200 |
| 2024 | $4,471 | $369,800 | $126,500 | $243,300 |
| 2023 | $4,410 | $340,300 | $119,800 | $220,500 |
| 2022 | $4,015 | $291,600 | $92,200 | $199,400 |
| 2021 | $3,621 | $249,900 | $87,800 | $162,100 |
| 2020 | $3,261 | $235,600 | $87,800 | $147,800 |
| 2019 | $2,760 | $212,800 | $87,800 | $125,000 |
| 2018 | $2,701 | $208,700 | $83,700 | $125,000 |
| 2017 | $2,728 | $201,600 | $83,700 | $117,900 |
| 2016 | $2,569 | $186,800 | $71,800 | $115,000 |
| 2015 | $2,499 | $186,800 | $71,800 | $115,000 |
| 2014 | $2,385 | $179,900 | $71,800 | $108,100 |
Source: Public Records
Map
Nearby Homes
- 90 Nathaniel Dr
- 18 East St Unit 24
- 1 Elm St
- 128 Linwood Ave
- 9 Banning Dr
- 21 Granite St
- 46 Rebecca Rd
- 192 Rebecca Rd
- 33 Crestwood Cir Unit 45
- 35 Crestwood Cir Unit 44
- 140 Rolling Ridge Dr Unit 78
- 28-30 Haringa Ave
- 39 Crestwood Cir Unit 42
- 86 Kingsnorth St
- 159 Rolling Ridge Dr Unit 85
- 169 Rolling Ridge Dr Unit 97
- 237 Heritage Dr Unit 237
- 831 Providence Rd Unit 837
- 3 Bayliss Way
- 157 Rolling Ridge Dr Unit 84
- 48-50 Spring St
- 38 Spring St Unit 40
- 49 Spring St Unit 51
- 34 Spring St Unit 36
- 43 Spring St Unit 47
- 43 Spring St Unit 1
- 39 Spring St Unit 41
- 57 Spring St
- 35 Spring St
- 1 Spring Terrace
- 30 Spring St
- 42 Pine St Unit 44
- 31 Spring St
- 40 Pine St
- 26 Spring St
- 2 Deane Way
- 36 Confidential
- lot 3 Hillside Garden Estatesdeane W
- Parcel A Prospect St
- Lot 4R Quaker St