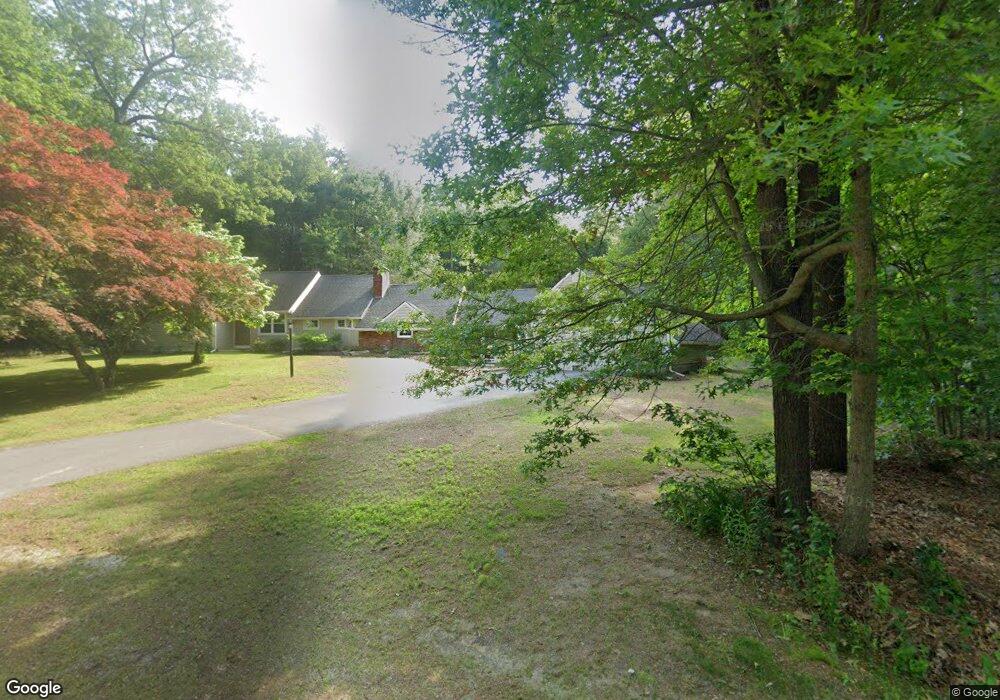
48 Strong Rd Southampton, MA 01073
Estimated Value: $503,223 - $612,000
4
Beds
3
Baths
2,100
Sq Ft
$258/Sq Ft
Est. Value
About This Home
This home is located at 48 Strong Rd, Southampton, MA 01073 and is currently estimated at $541,306, approximately $257 per square foot. 48 Strong Rd is a home located in Hampshire County with nearby schools including William E Norris School, White Oak School, and Calvary Baptist Christian School.
Ownership History
Date
Name
Owned For
Owner Type
Purchase Details
Closed on
Dec 7, 2009
Sold by
Patton Jon K and Patton Susan E
Bought by
Patton Susan E and Patton Sue E
Current Estimated Value
Purchase Details
Closed on
Mar 3, 2000
Sold by
Ogrady William J and Parker Cheryl A
Bought by
Patton John K and Patton Susan E
Create a Home Valuation Report for This Property
The Home Valuation Report is an in-depth analysis detailing your home's value as well as a comparison with similar homes in the area
Home Values in the Area
Average Home Value in this Area
Purchase History
We collect this data history from publicly available records. To have your information removed, we recommend requesting removal directly through your county’s website.
| Date | Buyer | Sale Price | Title Company |
|---|---|---|---|
| Patton Susan E | -- | -- | |
| Patton John K | $205,000 | -- |
Source: Public Records
Mortgage History
We collect this data history from publicly available records. To have your information removed, we recommend requesting removal directly through your county’s website.
| Date | Status | Borrower | Loan Amount |
|---|---|---|---|
| Open | Patton John K | $223,700 | |
| Closed | Patton John K | $228,000 |
Source: Public Records
Tax History
| Year | Tax Paid | Tax Assessment Tax Assessment Total Assessment is a certain percentage of the fair market value that is determined by local assessors to be the total taxable value of land and additions on the property. | Land | Improvement |
|---|---|---|---|---|
| 2025 | $5,890 | $415,700 | $105,200 | $310,500 |
| 2024 | $5,607 | $393,500 | $105,200 | $288,300 |
| 2023 | $5,226 | $364,700 | $105,200 | $259,500 |
| 2022 | $4,979 | $330,400 | $93,200 | $237,200 |
| 2021 | $4,858 | $304,200 | $87,900 | $216,300 |
| 2020 | $4,665 | $294,900 | $87,900 | $207,000 |
| 2019 | $4,546 | $278,700 | $87,900 | $190,800 |
| 2018 | $4,282 | $256,100 | $79,200 | $176,900 |
| 2017 | $4,180 | $256,100 | $79,200 | $176,900 |
| 2015 | $4,011 | $255,300 | $73,600 | $181,700 |
Source: Public Records
Map
Nearby Homes
- Lot 5 Brickyard Rd
- 224 College Hwy
- 216 College Hwy
- 57 White Loaf Rd
- 59 Gilbert Rd
- 3 Pomeroy Meadow Rd
- 10 Fitch Farm Way
- 8 Fitch Farm Way
- 12 Pomeroy St
- Lot 7,199 Pequot Rd
- 48 Gunn Rd
- 19 Beyer Dr
- 100 Pequot Rd
- 45 Pomeroy Meadow Rd
- 22 Bluemer Rd
- 33 Labrie Ln
- 50 Phelps St
- Lot 1 Nathaniel Hill
- 7 Western View Rd
- 7 Quigley Rd
Your Personal Tour Guide
Ask me questions while you tour the home.