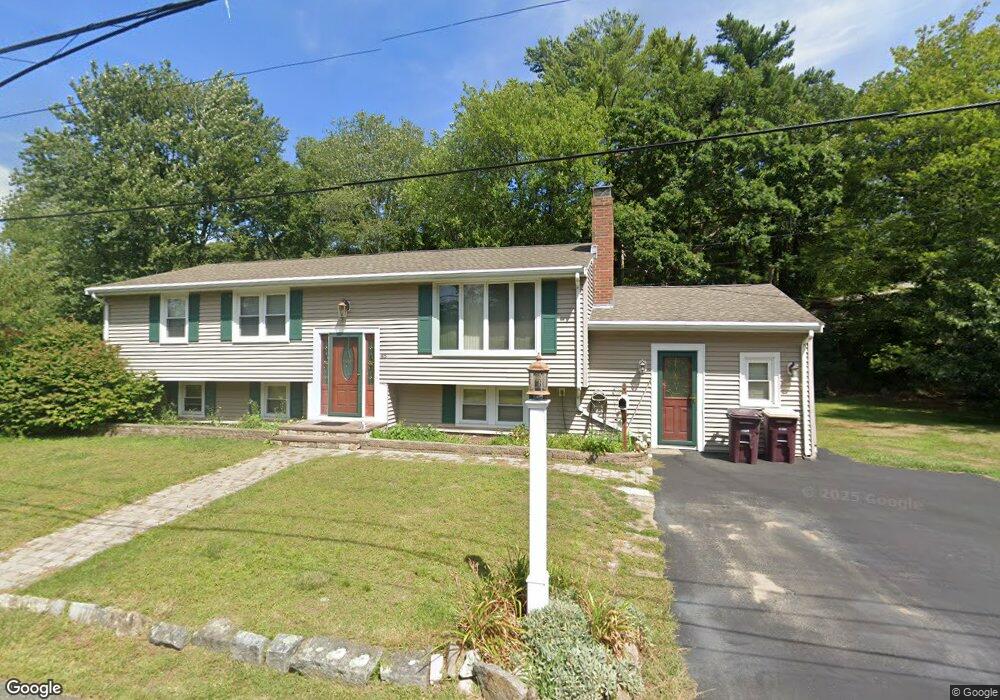
48 Sundin Rd Weymouth, MA 02188
Weymouth Landing NeighborhoodEstimated Value: $650,870 - $726,000
3
Beds
2
Baths
1,608
Sq Ft
$420/Sq Ft
Est. Value
About This Home
This home is located at 48 Sundin Rd, Weymouth, MA 02188 and is currently estimated at $675,968, approximately $420 per square foot. 48 Sundin Rd is a home located in Norfolk County with nearby schools including Abigail Adams Middle School, William Seach Elementary School, and Weymouth Middle School Chapman.
Ownership History
Date
Name
Owned For
Owner Type
Purchase Details
Closed on
Jun 23, 1988
Sold by
Kelly Michael J
Bought by
Carey James M
Current Estimated Value
Home Financials for this Owner
Home Financials are based on the most recent Mortgage that was taken out on this home.
Original Mortgage
$184,500
Interest Rate
10.32%
Mortgage Type
Purchase Money Mortgage
Create a Home Valuation Report for This Property
The Home Valuation Report is an in-depth analysis detailing your home's value as well as a comparison with similar homes in the area
Home Values in the Area
Average Home Value in this Area
Purchase History
| Date | Buyer | Sale Price | Title Company |
|---|---|---|---|
| Carey James M | $205,000 | -- |
Source: Public Records
Mortgage History
| Date | Status | Borrower | Loan Amount |
|---|---|---|---|
| Open | Carey James M | $173,000 | |
| Closed | Carey James M | $100,000 | |
| Closed | Carey James M | $84,500 | |
| Closed | Carey James M | $184,500 |
Source: Public Records
Tax History Compared to Growth
Tax History
| Year | Tax Paid | Tax Assessment Tax Assessment Total Assessment is a certain percentage of the fair market value that is determined by local assessors to be the total taxable value of land and additions on the property. | Land | Improvement |
|---|---|---|---|---|
| 2025 | $5,626 | $557,000 | $236,300 | $320,700 |
| 2024 | $5,558 | $541,200 | $225,100 | $316,100 |
| 2023 | $5,239 | $501,300 | $208,400 | $292,900 |
| 2022 | $5,109 | $445,800 | $193,000 | $252,800 |
| 2021 | $5,059 | $430,900 | $193,000 | $237,900 |
| 2020 | $4,994 | $419,000 | $193,000 | $226,000 |
| 2019 | $4,872 | $402,000 | $185,600 | $216,400 |
| 2018 | $4,793 | $383,400 | $176,700 | $206,700 |
| 2017 | $4,548 | $355,000 | $168,300 | $186,700 |
| 2016 | $4,448 | $347,500 | $161,900 | $185,600 |
| 2015 | $4,243 | $328,900 | $154,500 | $174,400 |
| 2014 | $4,098 | $308,100 | $143,800 | $164,300 |
Source: Public Records
Map
Nearby Homes
- 42 Sundin Rd
- 449 Middle St
- 303 Middle St
- 286 Essex St
- 12 Klasson Ln
- 286 Broad St
- 209 Lake St Unit 69
- 29-31 Broad Street Place
- 367 Essex St
- 575 Broad St Unit 305
- 575 Broad St Unit 215
- 209 Lake Shore Dr
- 211 Lake Shore Dr
- 145 Jaffrey St
- 19 Vine St Unit 3
- 19 Vine St Unit 1
- 33 Congress St
- 215 Winter St Unit 1P
- 114 Broad St Unit D
- 114 Broad St Unit C