Estimated Value: $318,000 - $461,000
4
Beds
3
Baths
2,369
Sq Ft
$163/Sq Ft
Est. Value
About This Home
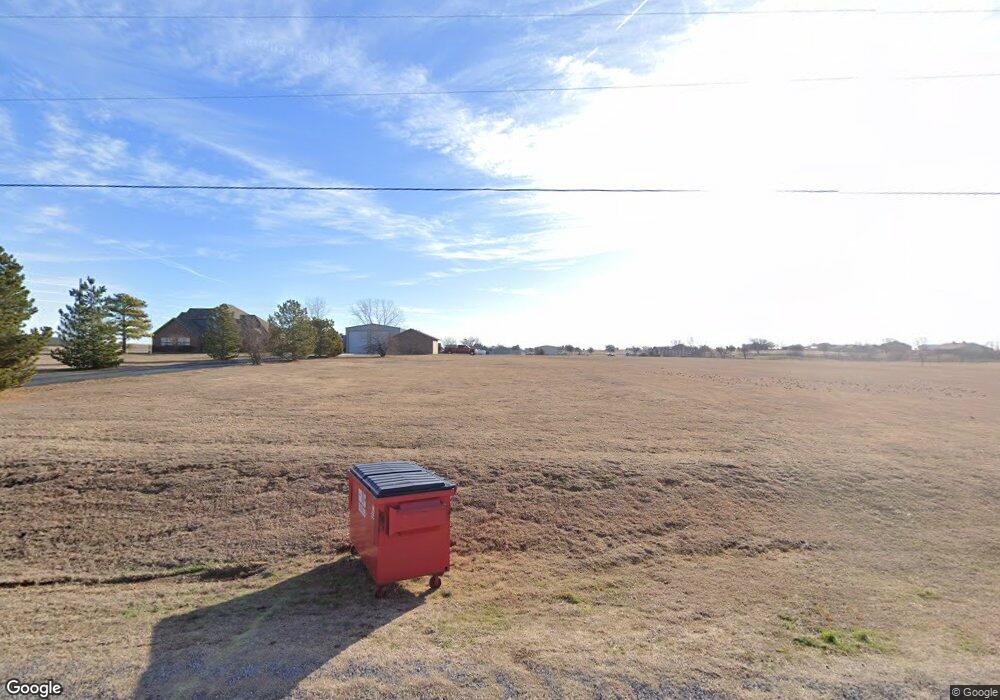
This home is located at 48 SW Logue Rd, Cache, OK 73527 and is currently estimated at $385,106, approximately $162 per square foot. 48 SW Logue Rd is a home located in Comanche County with nearby schools including Cache Primary Elementary School, Cache Intermediate Elementary School, and Cache Middle School.
Ownership History
Date
Name
Owned For
Owner Type
Purchase Details
Closed on
Aug 7, 2012
Sold by
County Comanche
Bought by
Grifith Anthony F and Grifith Betty J
Current Estimated Value
Purchase Details
Closed on
Jan 11, 2008
Sold by
Direnzo John and Direnzo Mary
Bought by
Griffith Anthony F
Home Financials for this Owner
Home Financials are based on the most recent Mortgage that was taken out on this home.
Original Mortgage
$235,000
Interest Rate
6.15%
Mortgage Type
VA
Purchase Details
Closed on
Jul 29, 1999
Sold by
Tartsah Rodney L and Tartsah Tammy~R
Purchase Details
Closed on
Nov 26, 1996
Sold by
Logue Albert H
Create a Home Valuation Report for This Property
The Home Valuation Report is an in-depth analysis detailing your home's value as well as a comparison with similar homes in the area
Purchase History
| Date | Buyer | Sale Price | Title Company |
|---|---|---|---|
| Grifith Anthony F | -- | None Available | |
| Griffith Anthony F | $235,000 | -- | |
| -- | $150,000 | -- | |
| -- | $15,800 | -- |
Source: Public Records
Mortgage History
| Date | Status | Borrower | Loan Amount |
|---|---|---|---|
| Previous Owner | Griffith Anthony F | $235,000 |
Source: Public Records
Tax History
| Year | Tax Paid | Tax Assessment Tax Assessment Total Assessment is a certain percentage of the fair market value that is determined by local assessors to be the total taxable value of land and additions on the property. | Land | Improvement |
|---|---|---|---|---|
| 2025 | $2,528 | $24,771 | $191 | $24,580 |
| 2024 | $2,487 | $24,050 | $191 | $23,859 |
| 2023 | $2,487 | $24,050 | $191 | $23,859 |
| 2022 | $2,556 | $23,718 | $191 | $23,527 |
| 2021 | $2,053 | $23,027 | $191 | $22,836 |
| 2020 | $2,165 | $22,356 | $191 | $22,165 |
| 2019 | $2,221 | $22,775 | $191 | $22,584 |
| 2018 | $2,252 | $22,825 | $190 | $22,635 |
| 2017 | $2,273 | $23,766 | $190 | $23,576 |
| 2016 | $2,466 | $26,124 | $190 | $25,934 |
| 2015 | $2,461 | $26,124 | $190 | $25,934 |
| 2014 | $2,416 | $25,998 | $190 | $25,808 |
Source: Public Records
Map
Nearby Homes
- 168 SW Crater Creek Rd
- 206 Meadowland
- 17168 W Gore Blvd
- 817 Hummingbird Dr
- 207 & 1/2 N Crater Creek Rd
- 209 E B Ave
- 703 SW 6th
- 206 W C Ave
- 207 C Ave
- 405 N Mountain Meadow Dr
- 111 S 6th St
- 815 W D Ave
- 112 NW Elm Ave
- 108 NW Elm Ave
- 433 NE Creekside Dr
- 357 SW Matthey Dr
- 205 NW Cherry Ave
- 207 Pine Ave
- 205 Pine Ave
- 206 Pine Ave
Your Personal Tour Guide
Ask me questions while you tour the home.