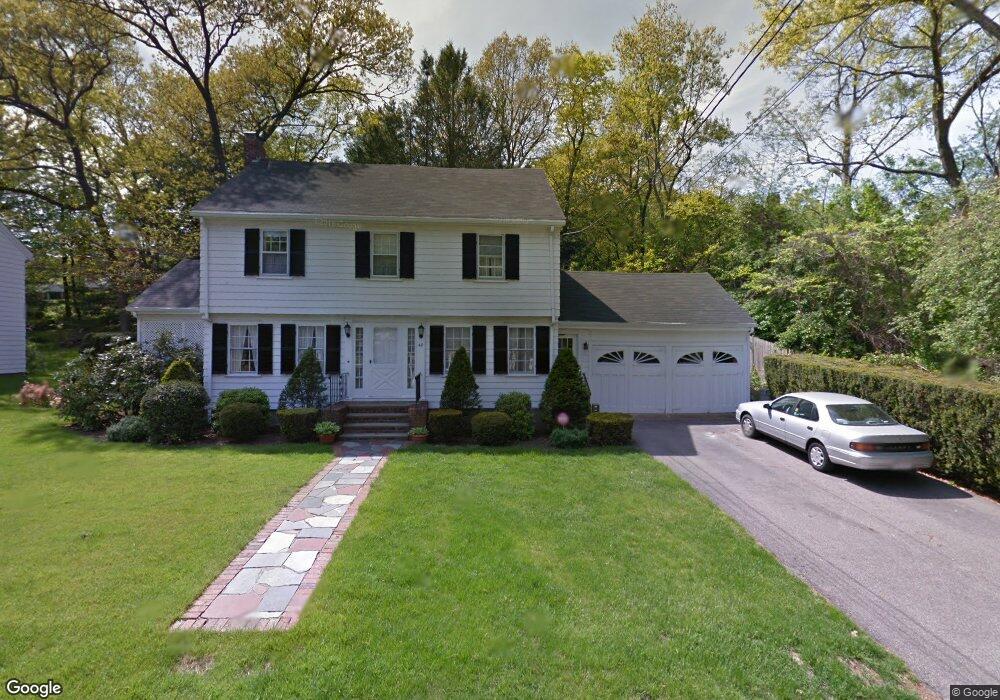
48 Talbot Rd Braintree, MA 02184
North Braintree NeighborhoodEstimated Value: $879,474 - $976,000
3
Beds
2
Baths
2,004
Sq Ft
$470/Sq Ft
Est. Value
About This Home
This home is located at 48 Talbot Rd, Braintree, MA 02184 and is currently estimated at $941,619, approximately $469 per square foot. 48 Talbot Rd is a home located in Norfolk County with nearby schools including Braintree High School, Step Ahead Kindergarten, and Meeting House Montessori School.
Ownership History
Date
Name
Owned For
Owner Type
Purchase Details
Closed on
Jul 25, 2025
Sold by
Valencia Harold A and Valencia Jeanne M
Bought by
Valencia
Current Estimated Value
Create a Home Valuation Report for This Property
The Home Valuation Report is an in-depth analysis detailing your home's value as well as a comparison with similar homes in the area
Home Values in the Area
Average Home Value in this Area
Purchase History
| Date | Buyer | Sale Price | Title Company |
|---|---|---|---|
| Valencia | -- | -- | |
| Valencia | -- | -- |
Source: Public Records
Tax History
| Year | Tax Paid | Tax Assessment Tax Assessment Total Assessment is a certain percentage of the fair market value that is determined by local assessors to be the total taxable value of land and additions on the property. | Land | Improvement |
|---|---|---|---|---|
| 2025 | $8,622 | $863,900 | $402,800 | $461,100 |
| 2024 | $7,801 | $822,900 | $378,800 | $444,100 |
| 2023 | $7,283 | $746,200 | $326,100 | $420,100 |
| 2022 | $7,043 | $707,800 | $287,700 | $420,100 |
| 2021 | $6,823 | $685,700 | $289,600 | $396,100 |
| 2020 | $6,761 | $685,700 | $289,600 | $396,100 |
| 2019 | $6,363 | $630,600 | $276,200 | $354,400 |
| 2018 | $5,909 | $560,600 | $220,600 | $340,000 |
| 2017 | $5,721 | $532,700 | $207,100 | $325,600 |
| 2016 | $5,638 | $513,500 | $207,100 | $306,400 |
| 2015 | $5,552 | $501,500 | $207,100 | $294,400 |
| 2014 | $5,174 | $453,100 | $180,300 | $272,800 |
Source: Public Records
Map
Nearby Homes
- 87 Walnut St
- 7 Del's Way
- 5 Woodsum Dr Unit 12
- 18 Royal Lake Dr Unit 3
- 15 Calvin St
- 491 Washington St Unit 1
- 469-471 Washington St
- 47 Addison St
- 6 Franklin St
- 20 Blossom Rd
- 63 Dickerman Ln
- 29 Joseph Rd
- 145 Hancock St Unit 307
- 145 Hancock St Unit 201
- 20 Vine St
- 44 Shepard Rd
- 50 Cleveland Ave
- 6 Lunar Ave
- 36 Chestnut Ave
- 80 Lake St
Your Personal Tour Guide
Ask me questions while you tour the home.