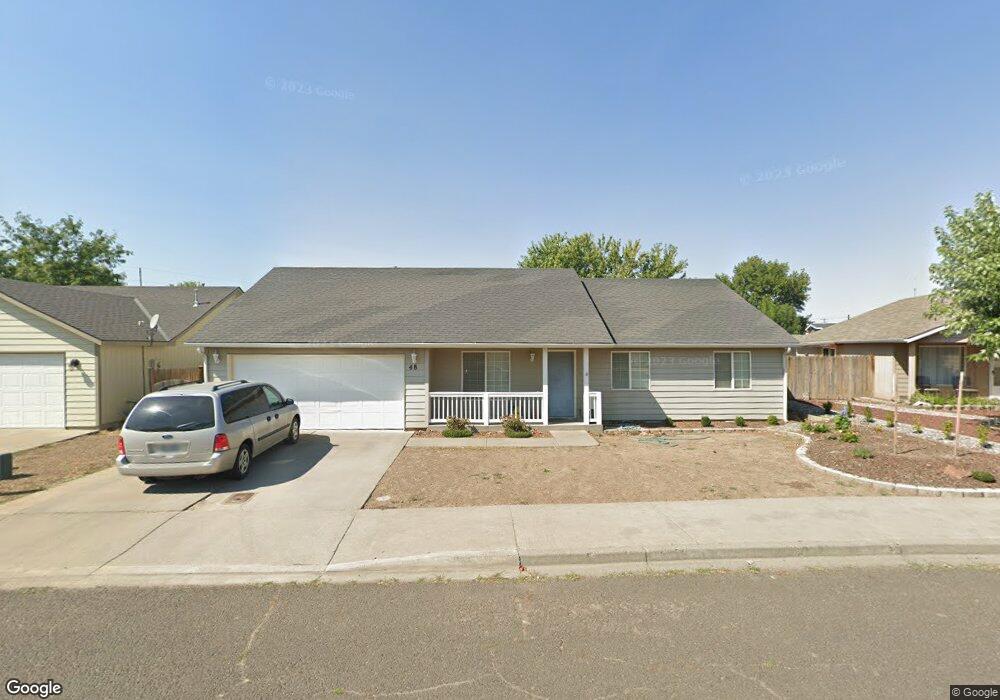
48 Talon Loop Walla Walla, WA 99362
Estimated Value: $399,974 - $438,000
3
Beds
2
Baths
1,500
Sq Ft
$283/Sq Ft
Est. Value
About This Home
This home is located at 48 Talon Loop, Walla Walla, WA 99362 and is currently estimated at $424,994, approximately $283 per square foot. 48 Talon Loop is a home located in Walla Walla County with nearby schools including Berney Elementary School, Pioneer Middle School, and Assumption School.
Ownership History
Date
Name
Owned For
Owner Type
Purchase Details
Closed on
Jun 3, 2021
Sold by
Mcfari Fred and Mcfari Donna L
Bought by
Mcfarland Fred and Mcfarland Donna L
Current Estimated Value
Home Financials for this Owner
Home Financials are based on the most recent Mortgage that was taken out on this home.
Original Mortgage
$123,000
Interest Rate
2.9%
Mortgage Type
New Conventional
Purchase Details
Closed on
Jun 27, 2005
Sold by
Sotelo Frank S and Sotelo Janie
Bought by
Mcfarland Fred and Mcfarland Donna L
Home Financials for this Owner
Home Financials are based on the most recent Mortgage that was taken out on this home.
Original Mortgage
$109,000
Interest Rate
5.65%
Mortgage Type
New Conventional
Create a Home Valuation Report for This Property
The Home Valuation Report is an in-depth analysis detailing your home's value as well as a comparison with similar homes in the area
Purchase History
| Date | Buyer | Sale Price | Title Company |
|---|---|---|---|
| Mcfarland Fred | -- | None Listed On Document | |
| Mcfarland Fred | $188,673 | Walla Walla Title Company |
Source: Public Records
Mortgage History
| Date | Status | Borrower | Loan Amount |
|---|---|---|---|
| Previous Owner | Mcfarland Fred | $123,000 | |
| Previous Owner | Mcfarland Fred | $109,000 |
Source: Public Records
Tax History
| Year | Tax Paid | Tax Assessment Tax Assessment Total Assessment is a certain percentage of the fair market value that is determined by local assessors to be the total taxable value of land and additions on the property. | Land | Improvement |
|---|---|---|---|---|
| 2025 | $3,767 | $410,530 | $80,000 | $330,530 |
| 2024 | $3,243 | $380,480 | $80,000 | $300,480 |
| 2023 | $3,243 | $366,170 | $80,000 | $286,170 |
| 2022 | $2,868 | $318,390 | $50,000 | $268,390 |
| 2021 | $2,829 | $264,720 | $50,000 | $214,720 |
| 2020 | $2,797 | $236,710 | $50,000 | $186,710 |
| 2019 | $2,427 | $236,710 | $50,000 | $186,710 |
| 2018 | $2,755 | $224,490 | $50,000 | $174,490 |
| 2017 | $2,431 | $208,630 | $50,000 | $158,630 |
| 2016 | $2,370 | $198,630 | $40,000 | $158,630 |
| 2015 | $2,414 | $184,210 | $40,000 | $144,210 |
| 2014 | -- | $191,800 | $40,000 | $151,800 |
| 2013 | -- | $191,800 | $40,000 | $151,800 |
Source: Public Records
Map
Nearby Homes
- 2335 Hawk Dr
- 144 & 146 S Tausick Way
- 64 Talon Loop
- 1180 Fortune Dr
- 249 Tausick Way
- 372 Chardonnay Ct
- 476 Reserve Way
- 2004 Mary Ln
- 2009 Wallace St
- 3 Copacetic Ct
- 6 Copacetic Ct
- 5 Copacetic Ct
- 4 Copacetic Ct
- 118 Bush St
- 177 Laurel St
- 1221 Arkansas Dr
- 1723 Ruth St
- 2219 E Isaacs Ave Unit 16
- 2836 Concord Ln
- 1813 Pleasant St
Your Personal Tour Guide
Ask me questions while you tour the home.