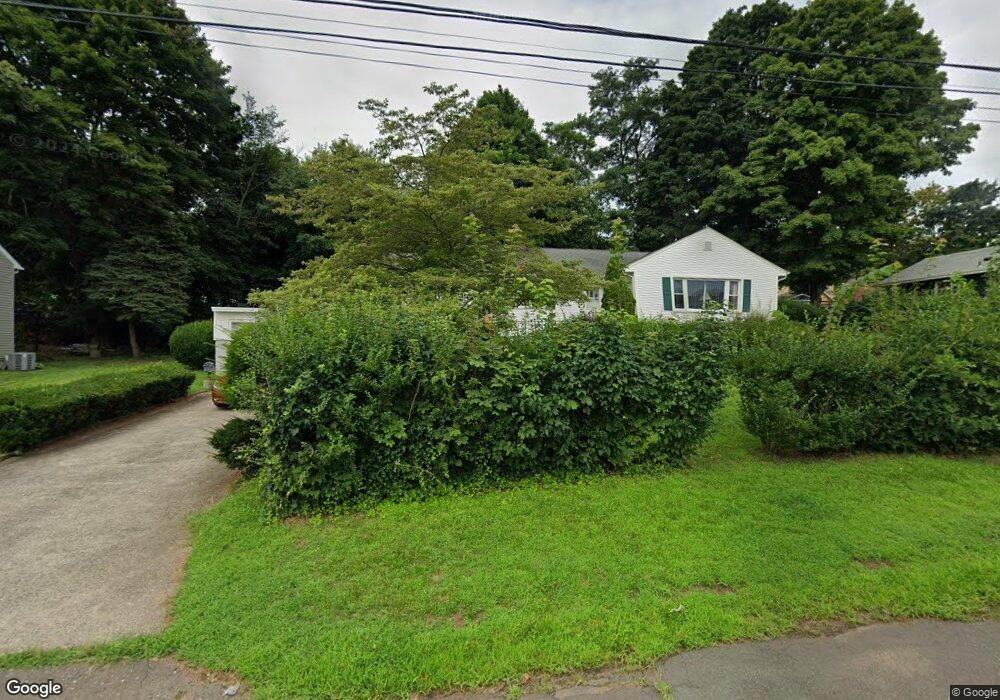
48 Union Ave East Haven, CT 06512
Estimated Value: $365,559 - $406,000
2
Beds
2
Baths
1,442
Sq Ft
$267/Sq Ft
Est. Value
About This Home
This home is located at 48 Union Ave, East Haven, CT 06512 and is currently estimated at $385,390, approximately $267 per square foot. 48 Union Ave is a home located in New Haven County with nearby schools including East Haven High School, Cold Spring School, and Pathway School.
Ownership History
Date
Name
Owned For
Owner Type
Purchase Details
Closed on
Nov 16, 2018
Sold by
Deluca Anna
Bought by
Deluca Anna and Granata Arlene
Current Estimated Value
Create a Home Valuation Report for This Property
The Home Valuation Report is an in-depth analysis detailing your home's value as well as a comparison with similar homes in the area
Home Values in the Area
Average Home Value in this Area
Purchase History
| Date | Buyer | Sale Price | Title Company |
|---|---|---|---|
| Deluca Anna | -- | -- |
Source: Public Records
Mortgage History
| Date | Status | Borrower | Loan Amount |
|---|---|---|---|
| Open | Deluca Anna | $149,000 | |
| Previous Owner | Deluca Anna | $114,000 |
Source: Public Records
Tax History Compared to Growth
Tax History
| Year | Tax Paid | Tax Assessment Tax Assessment Total Assessment is a certain percentage of the fair market value that is determined by local assessors to be the total taxable value of land and additions on the property. | Land | Improvement |
|---|---|---|---|---|
| 2025 | $5,419 | $162,050 | $38,710 | $123,340 |
| 2024 | $5,419 | $162,050 | $38,710 | $123,340 |
| 2023 | $5,056 | $162,050 | $38,710 | $123,340 |
| 2022 | $5,056 | $162,050 | $38,710 | $123,340 |
| 2021 | $4,595 | $134,160 | $38,700 | $95,460 |
| 2020 | $4,595 | $134,160 | $38,700 | $95,460 |
| 2019 | $4,349 | $134,160 | $38,700 | $95,460 |
| 2018 | $4,353 | $134,160 | $38,700 | $95,460 |
| 2017 | $4,233 | $134,160 | $38,700 | $95,460 |
| 2016 | $4,453 | $141,150 | $45,730 | $95,420 |
| 2015 | $4,453 | $141,150 | $45,730 | $95,420 |
| 2014 | $4,524 | $141,150 | $45,730 | $95,420 |
Source: Public Records
Map
Nearby Homes
- 237 N High St
- 111 & 111A Laurel St
- 20 Weber St
- 93 Kimberly Ave
- 71 High St
- 47 Guilford Ct
- 17 Guilford Ct
- 103 Saltonstall Pkwy
- 300 Bradley St
- 364 Main St Unit 47
- 23 Pondview Terrace
- 20 Lakeview Dr
- 133 Charter Oak Ave
- 34 River St
- 14 Gerrish Ave
- 458 Thompson Ave
- 68 Dominican Rd
- 34 Hughes St
- 560 Bradley St
- 18 Lenox St