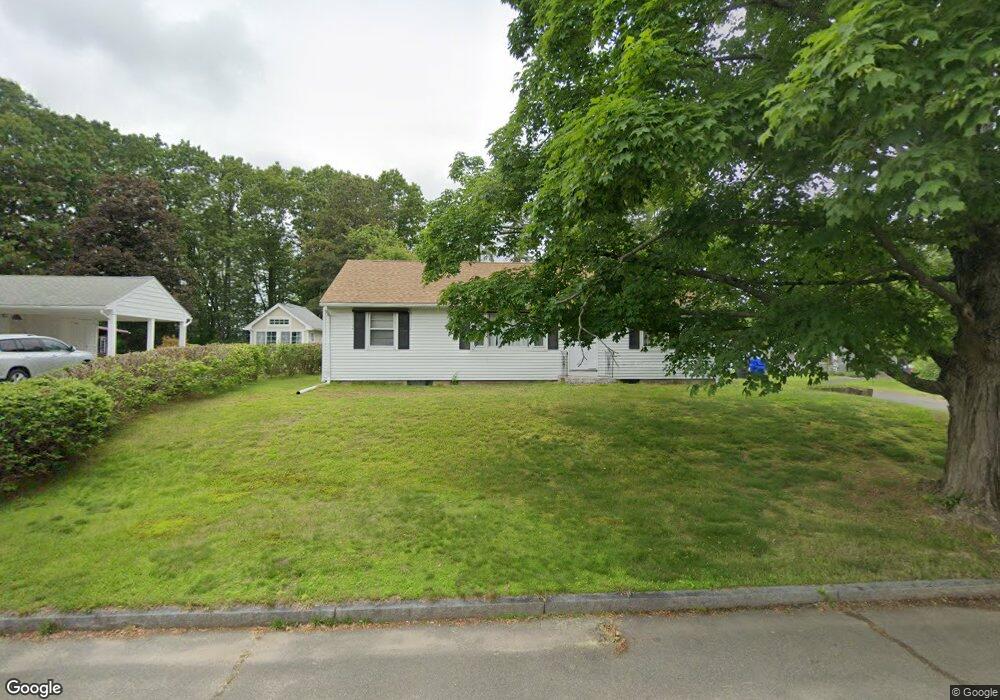
48 Varney St Springfield, MA 01108
Forest Park NeighborhoodEstimated Value: $263,000 - $293,000
3
Beds
1
Bath
1,056
Sq Ft
$267/Sq Ft
Est. Value
About This Home
This home is located at 48 Varney St, Springfield, MA 01108 and is currently estimated at $281,750, approximately $266 per square foot. 48 Varney St is a home located in Hampden County with nearby schools including Alice B. Beal Elementary School, Forest Park Middle School, and High School Of Commerce.
Ownership History
Date
Name
Owned For
Owner Type
Purchase Details
Closed on
Sep 21, 2022
Sold by
Deridder Terra D
Bought by
Deridder Terra D and Deridder Lydia R
Current Estimated Value
Purchase Details
Closed on
Jan 19, 2010
Sold by
Deridder James and Deridder Terra
Bought by
Deridder Terra D and Brainerd Mary K
Home Financials for this Owner
Home Financials are based on the most recent Mortgage that was taken out on this home.
Original Mortgage
$111,395
Interest Rate
5.5%
Mortgage Type
FHA
Purchase Details
Closed on
May 17, 2002
Sold by
Est Savage Sidney J and Manning Stephen R
Bought by
Deridder James and Deridder Terra
Home Financials for this Owner
Home Financials are based on the most recent Mortgage that was taken out on this home.
Original Mortgage
$84,800
Interest Rate
7.15%
Mortgage Type
Purchase Money Mortgage
Create a Home Valuation Report for This Property
The Home Valuation Report is an in-depth analysis detailing your home's value as well as a comparison with similar homes in the area
Home Values in the Area
Average Home Value in this Area
Purchase History
| Date | Buyer | Sale Price | Title Company |
|---|---|---|---|
| Deridder Terra D | -- | None Available | |
| Deridder Terra D | -- | None Available | |
| Deridder Terra D | -- | -- | |
| Deridder James | $106,000 | -- |
Source: Public Records
Mortgage History
| Date | Status | Borrower | Loan Amount |
|---|---|---|---|
| Previous Owner | Deridder Terra D | $111,395 | |
| Previous Owner | Deridder James | $84,800 |
Source: Public Records
Tax History Compared to Growth
Tax History
| Year | Tax Paid | Tax Assessment Tax Assessment Total Assessment is a certain percentage of the fair market value that is determined by local assessors to be the total taxable value of land and additions on the property. | Land | Improvement |
|---|---|---|---|---|
| 2025 | $3,145 | $200,600 | $49,400 | $151,200 |
| 2024 | $3,241 | $201,800 | $49,400 | $152,400 |
| 2023 | $3,248 | $190,500 | $41,800 | $148,700 |
| 2022 | $2,729 | $145,000 | $41,800 | $103,200 |
| 2021 | $2,911 | $154,000 | $38,000 | $116,000 |
| 2020 | $2,781 | $142,400 | $38,000 | $104,400 |
| 2019 | $2,696 | $137,000 | $38,000 | $99,000 |
| 2018 | $2,578 | $131,000 | $38,000 | $93,000 |
| 2017 | $2,459 | $125,100 | $38,000 | $87,100 |
| 2016 | $2,288 | $116,400 | $38,000 | $78,400 |
| 2015 | $2,258 | $114,800 | $38,000 | $76,800 |
Source: Public Records
Map
Nearby Homes