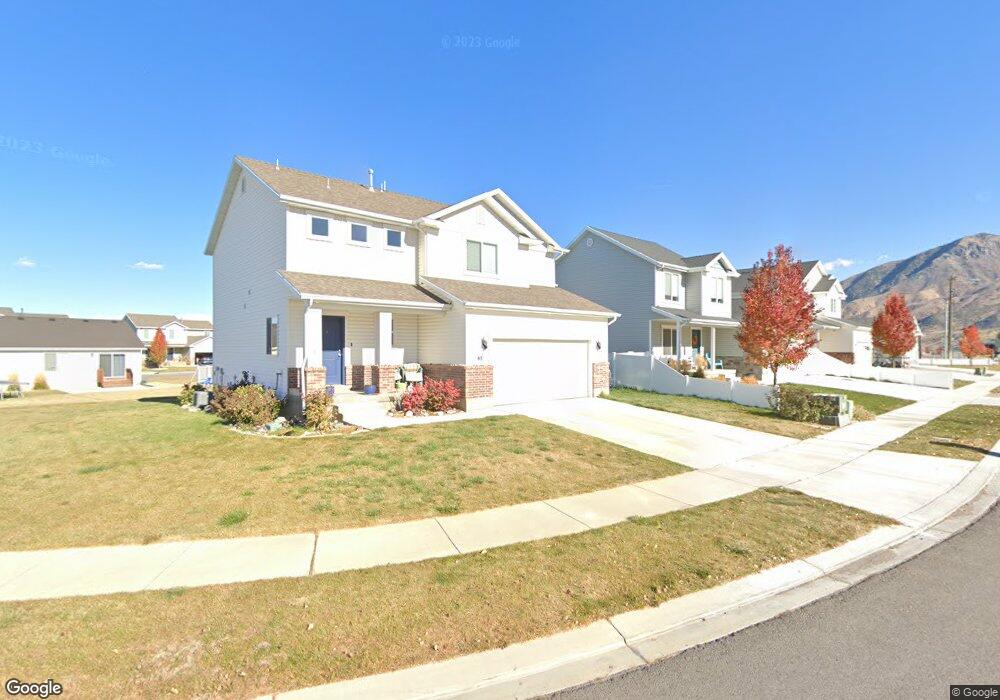
48 W Orchard Cove Dr Santaquin, UT 84655
Estimated Value: $489,000 - $554,000
4
Beds
3
Baths
1,914
Sq Ft
$273/Sq Ft
Est. Value
About This Home
This home is located at 48 W Orchard Cove Dr, Santaquin, UT 84655 and is currently estimated at $522,995, approximately $273 per square foot. 48 W Orchard Cove Dr is a home with nearby schools including Apple Valley Elementary, Payson Junior High School, and Payson High School.
Ownership History
Date
Name
Owned For
Owner Type
Purchase Details
Closed on
Apr 16, 2018
Sold by
Sierra Homes Construction South Llc
Bought by
Musson Samuel R and Musson Kellynn
Current Estimated Value
Home Financials for this Owner
Home Financials are based on the most recent Mortgage that was taken out on this home.
Original Mortgage
$288,833
Outstanding Balance
$248,392
Interest Rate
4.44%
Mortgage Type
New Conventional
Estimated Equity
$274,603
Purchase Details
Closed on
Sep 26, 2017
Sold by
Santaqui Development Llc
Bought by
Sierra Homes Construction South Lcl
Create a Home Valuation Report for This Property
The Home Valuation Report is an in-depth analysis detailing your home's value as well as a comparison with similar homes in the area
Home Values in the Area
Average Home Value in this Area
Purchase History
| Date | Buyer | Sale Price | Title Company |
|---|---|---|---|
| Musson Samuel R | -- | American Secure Title Tremon | |
| Sierra Homes Construction South Lcl | -- | American Secure Title Tremon |
Source: Public Records
Mortgage History
| Date | Status | Borrower | Loan Amount |
|---|---|---|---|
| Open | Musson Samuel R | $288,833 | |
| Closed | Sierra Homes Construction South Lcl | $0 |
Source: Public Records
Tax History Compared to Growth
Tax History
| Year | Tax Paid | Tax Assessment Tax Assessment Total Assessment is a certain percentage of the fair market value that is determined by local assessors to be the total taxable value of land and additions on the property. | Land | Improvement |
|---|---|---|---|---|
| 2025 | $2,227 | $249,865 | $136,100 | $318,200 |
| 2024 | $2,227 | $221,760 | $0 | $0 |
| 2023 | $2,334 | $233,145 | $0 | $0 |
| 2022 | $2,297 | $236,720 | $0 | $0 |
| 2021 | $1,979 | $316,100 | $76,700 | $239,400 |
| 2020 | $1,904 | $294,700 | $66,700 | $228,000 |
| 2019 | $1,674 | $265,000 | $66,700 | $198,300 |
| 2018 | $1,014 | $84,150 | $0 | $0 |
Source: Public Records
Map
Nearby Homes
- 41 W 770 N
- 116 E 840 N
- 162 W 690 N
- 894 N Apple Seed Ln
- 600 N Center St
- 933 N 200 E
- 933 N 200 E Unit 32
- 109 W 930 N
- 931 N 160 E Unit 11
- 931 N 160 E
- 921 N 160 E
- 921 N 160 E Unit 12
- 932 N 160 E Unit 21
- 922 N 160 E Unit 20
- 961 N 120 E
- Pine Plan at Stratton Acres
- Willow Plan at Stratton Acres
- Aspen Plan at Stratton Acres
- Cottonwood Plan at Stratton Acres
- 951 N 215 W