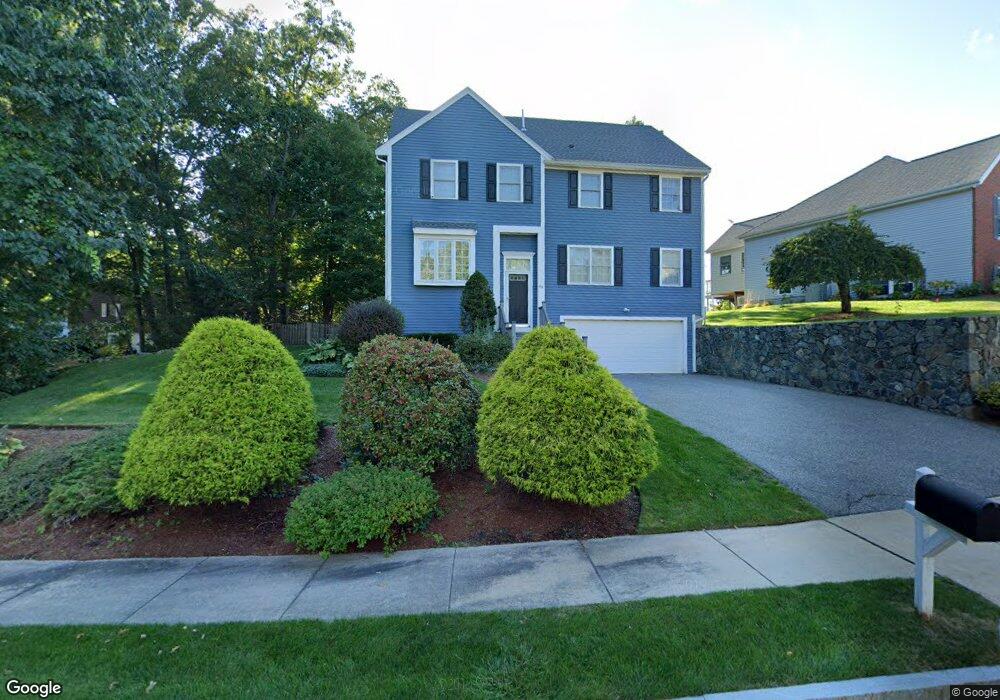
48 Walsh Ave Stoneham, MA 02180
Colonial Park NeighborhoodEstimated Value: $1,181,000 - $1,293,000
4
Beds
3
Baths
2,846
Sq Ft
$428/Sq Ft
Est. Value
About This Home
This home is located at 48 Walsh Ave, Stoneham, MA 02180 and is currently estimated at $1,219,018, approximately $428 per square foot. 48 Walsh Ave is a home located in Middlesex County with nearby schools including Stoneham High School, St. Patrick Elementary School, and Melrose Montessori School.
Ownership History
Date
Name
Owned For
Owner Type
Purchase Details
Closed on
Mar 18, 2022
Sold by
Oneill Stephen J and Oneill Janet M
Bought by
Janet M Oneill Ret 2020
Current Estimated Value
Purchase Details
Closed on
Aug 15, 1997
Sold by
Republic Bldrs Inc
Bought by
Oneill Stephen J and Oneill Janet M
Home Financials for this Owner
Home Financials are based on the most recent Mortgage that was taken out on this home.
Original Mortgage
$240,000
Interest Rate
7.56%
Mortgage Type
Purchase Money Mortgage
Create a Home Valuation Report for This Property
The Home Valuation Report is an in-depth analysis detailing your home's value as well as a comparison with similar homes in the area
Home Values in the Area
Average Home Value in this Area
Purchase History
We collect this data history from publicly available records. To have your information removed, we recommend requesting removal directly through your county’s website.
| Date | Buyer | Sale Price | Title Company |
|---|---|---|---|
| Janet M Oneill Ret 2020 | -- | None Available | |
| Oneill Stephen J | $335,000 | -- |
Source: Public Records
Mortgage History
We collect this data history from publicly available records. To have your information removed, we recommend requesting removal directly through your county’s website.
| Date | Status | Borrower | Loan Amount |
|---|---|---|---|
| Previous Owner | Oneill Stephen J | $240,600 | |
| Previous Owner | Oneill Stephen J | $240,000 |
Source: Public Records
Tax History
| Year | Tax Paid | Tax Assessment Tax Assessment Total Assessment is a certain percentage of the fair market value that is determined by local assessors to be the total taxable value of land and additions on the property. | Land | Improvement |
|---|---|---|---|---|
| 2025 | $10,377 | $1,014,400 | $400,200 | $614,200 |
| 2024 | $9,910 | $935,800 | $370,200 | $565,600 |
| 2023 | $9,643 | $868,700 | $340,200 | $528,500 |
| 2022 | $8,504 | $816,900 | $320,200 | $496,700 |
| 2021 | $8,347 | $771,400 | $300,200 | $471,200 |
| 2020 | $8,265 | $766,000 | $300,200 | $465,800 |
| 2019 | $8,210 | $731,700 | $270,200 | $461,500 |
| 2018 | $8,053 | $687,700 | $250,200 | $437,500 |
| 2017 | $8,336 | $672,800 | $240,200 | $432,600 |
| 2016 | $8,020 | $631,500 | $230,200 | $401,300 |
| 2015 | $8,016 | $618,500 | $230,200 | $388,300 |
| 2014 | $8,072 | $598,400 | $220,200 | $378,200 |
Source: Public Records
Map
Nearby Homes
- 7 Rivers Ln
- 25 Ellen Rd
- 6 Gavin Cir
- 3 Fellsmere Ave
- 20 Landers Rd
- 185 Franklin St
- 181 Franklin St
- 12 Lovis Ave
- 159 Franklin St Unit E6
- 50 Gould St Unit 1
- 126 Green St
- 5 Washington St
- 181 Green St
- 76 Perkins St
- 601 Franklin St Unit 2
- 28 Washington St
- 974 Main St Unit 23
- 269 Green St
- 2 Pine St Unit 3
- 7 Pine St
Your Personal Tour Guide
Ask me questions while you tour the home.