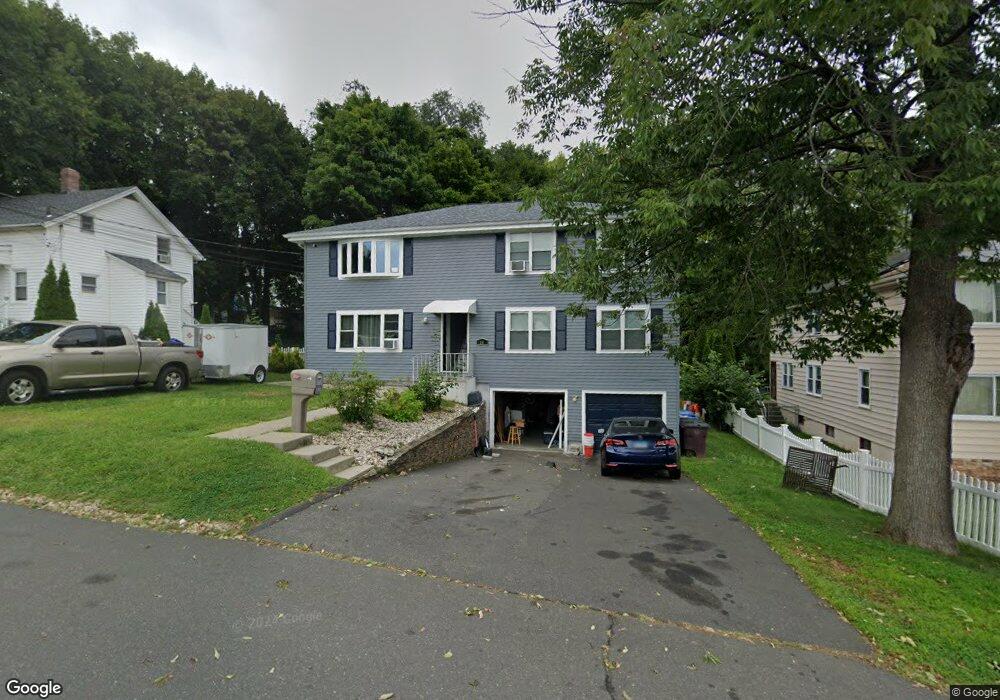
48 Walsh St New Britain, CT 06051
Estimated Value: $390,243 - $499,000
6
Beds
2
Baths
2,816
Sq Ft
$155/Sq Ft
Est. Value
About This Home
This home is located at 48 Walsh St, New Britain, CT 06051 and is currently estimated at $437,311, approximately $155 per square foot. 48 Walsh St is a home located in Hartford County with nearby schools including Vance School, Slade Middle School, and St Paul School.
Ownership History
Date
Name
Owned For
Owner Type
Purchase Details
Closed on
Sep 30, 2011
Sold by
Mauroza Monserrate H
Bought by
Martinez Rafael
Current Estimated Value
Home Financials for this Owner
Home Financials are based on the most recent Mortgage that was taken out on this home.
Original Mortgage
$193,400
Outstanding Balance
$128,031
Interest Rate
3.5%
Mortgage Type
FHA
Estimated Equity
$309,280
Purchase Details
Closed on
Nov 23, 1999
Sold by
Martinez Felix M
Bought by
Mauroza Monserrate H
Purchase Details
Closed on
May 24, 1996
Sold by
Martinez Felix M
Bought by
Mauroza Monserrate and Martinez Felix
Purchase Details
Closed on
May 31, 1994
Sold by
Tricarico Peter
Bought by
Martinez Flex M
Home Financials for this Owner
Home Financials are based on the most recent Mortgage that was taken out on this home.
Original Mortgage
$96,000
Interest Rate
4%
Mortgage Type
Unknown
Create a Home Valuation Report for This Property
The Home Valuation Report is an in-depth analysis detailing your home's value as well as a comparison with similar homes in the area
Home Values in the Area
Average Home Value in this Area
Purchase History
| Date | Buyer | Sale Price | Title Company |
|---|---|---|---|
| Martinez Rafael | $198,500 | -- | |
| Mauroza Monserrate H | $16,000 | -- | |
| Mauroza Monserrate | $60,000 | -- | |
| Martinez Flex M | $120,000 | -- |
Source: Public Records
Mortgage History
| Date | Status | Borrower | Loan Amount |
|---|---|---|---|
| Open | Martinez Flex M | $193,400 | |
| Closed | Martinez Flex M | $8,000 | |
| Previous Owner | Martinez Flex M | $92,000 | |
| Previous Owner | Martinez Flex M | $96,000 |
Source: Public Records
Tax History Compared to Growth
Tax History
| Year | Tax Paid | Tax Assessment Tax Assessment Total Assessment is a certain percentage of the fair market value that is determined by local assessors to be the total taxable value of land and additions on the property. | Land | Improvement |
|---|---|---|---|---|
| 2025 | $7,825 | $199,710 | $47,530 | $152,180 |
| 2024 | $7,907 | $199,710 | $47,530 | $152,180 |
| 2023 | $7,645 | $199,710 | $47,530 | $152,180 |
| 2022 | $6,847 | $138,320 | $21,910 | $116,410 |
| 2021 | $6,847 | $138,320 | $21,910 | $116,410 |
| 2020 | $6,985 | $138,320 | $21,910 | $116,410 |
| 2019 | $6,985 | $138,320 | $21,910 | $116,410 |
| 2018 | $6,985 | $138,320 | $21,910 | $116,410 |
| 2017 | $6,869 | $136,010 | $20,090 | $115,920 |
| 2016 | $6,869 | $136,010 | $20,090 | $115,920 |
| 2015 | $6,664 | $136,010 | $20,090 | $115,920 |
| 2014 | $6,664 | $136,010 | $20,090 | $115,920 |
Source: Public Records
Map
Nearby Homes
- 243 Pond St
- 30 Norden St
- 27 Andrews St
- 100 Shuttle Meadow Ave
- 86 Buell St
- 70 Monroe St
- 305 Lincoln St
- 44 Brook St
- 19 Madison St
- 21 Trinity St Unit 23
- 266 Farmington Ave
- 383 S Main St
- 62 Cedarwood Rd
- 126 Winthrop St
- 239 Glen St Unit 2A
- 93 Winthrop St
- 170 Dayl Dr
- 565 Lincoln St
- 270 Maple St
- 380 Arch St