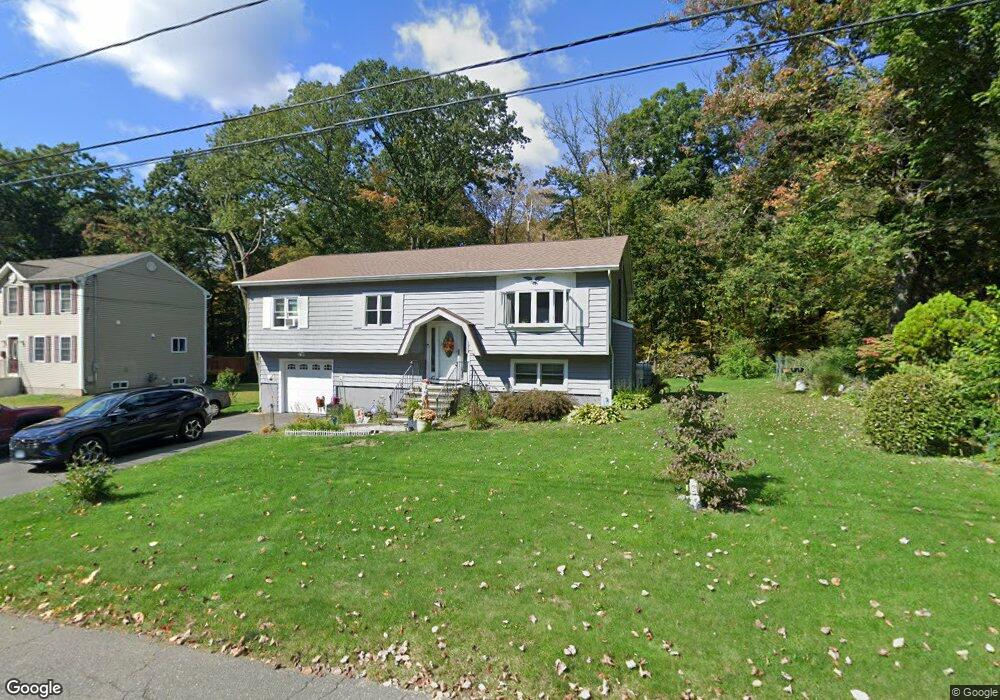
48 Warren Ave Naugatuck, CT 06770
Estimated Value: $345,000 - $367,000
3
Beds
2
Baths
1,257
Sq Ft
$285/Sq Ft
Est. Value
About This Home
This home is located at 48 Warren Ave, Naugatuck, CT 06770 and is currently estimated at $358,250, approximately $285 per square foot. 48 Warren Ave is a home located in New Haven County with nearby schools including City Hill Middle School and Naugatuck High School.
Ownership History
Date
Name
Owned For
Owner Type
Purchase Details
Closed on
Oct 2, 2024
Sold by
Bene Lewis
Bought by
Bene Lewis S and Bene Gina A
Current Estimated Value
Purchase Details
Closed on
Dec 28, 2006
Sold by
Cochiola William and Cooper Victoria
Bought by
Bene Lewis S
Home Financials for this Owner
Home Financials are based on the most recent Mortgage that was taken out on this home.
Original Mortgage
$243,500
Interest Rate
6.29%
Mortgage Type
Purchase Money Mortgage
Purchase Details
Closed on
Feb 1, 2006
Sold by
Grailich John J and Grailich Chun Hui
Bought by
Cocchiola William and Cooper Victroria
Home Financials for this Owner
Home Financials are based on the most recent Mortgage that was taken out on this home.
Original Mortgage
$217,900
Interest Rate
8.99%
Mortgage Type
Purchase Money Mortgage
Purchase Details
Closed on
Jan 19, 1999
Sold by
Vitzoski Carol and Vitzoski Allan
Bought by
Grailich John and Grailich Chun Hui
Create a Home Valuation Report for This Property
The Home Valuation Report is an in-depth analysis detailing your home's value as well as a comparison with similar homes in the area
Home Values in the Area
Average Home Value in this Area
Purchase History
| Date | Buyer | Sale Price | Title Company |
|---|---|---|---|
| Bene Lewis S | -- | None Available | |
| Bene Lewis S | -- | None Available | |
| Bene Lewis S | $243,500 | -- | |
| Cocchiola William | $217,900 | -- | |
| Grailich John | $115,000 | -- | |
| Bene Lewis S | $243,500 | -- | |
| Cocchiola William | $217,900 | -- | |
| Grailich John | $115,000 | -- |
Source: Public Records
Mortgage History
| Date | Status | Borrower | Loan Amount |
|---|---|---|---|
| Previous Owner | Grailich John | $243,500 | |
| Previous Owner | Grailich John | $217,900 |
Source: Public Records
Tax History Compared to Growth
Tax History
| Year | Tax Paid | Tax Assessment Tax Assessment Total Assessment is a certain percentage of the fair market value that is determined by local assessors to be the total taxable value of land and additions on the property. | Land | Improvement |
|---|---|---|---|---|
| 2025 | $6,699 | $168,350 | $29,680 | $138,670 |
| 2024 | $7,035 | $168,350 | $29,680 | $138,670 |
| 2023 | $7,534 | $168,350 | $29,680 | $138,670 |
| 2022 | $6,086 | $127,450 | $31,840 | $95,610 |
| 2021 | $6,086 | $127,450 | $31,840 | $95,610 |
| 2020 | $6,086 | $127,450 | $31,840 | $95,610 |
| 2019 | $6,022 | $127,450 | $31,840 | $95,610 |
| 2018 | $5,502 | $113,790 | $38,310 | $75,480 |
| 2017 | $5,525 | $113,790 | $38,310 | $75,480 |
| 2016 | $5,424 | $113,790 | $38,310 | $75,480 |
| 2015 | $5,185 | $113,790 | $38,310 | $75,480 |
| 2014 | $5,127 | $113,790 | $38,310 | $75,480 |
| 2012 | $5,223 | $155,670 | $48,370 | $107,300 |
Source: Public Records
Map
Nearby Homes
- 856 New Haven Rd
- 848 New Haven Rd
- 141 General Patton Dr
- 71 Wisteria Dr
- 4 Wintergreen Ln
- 170 Darcangelo Dr
- 122 Celentano Dr
- 1081 New Haven Rd Unit 4C
- 62 Cambridge Ct
- 166 Wisteria Dr
- 194 Beacon Valley Rd Unit Parcel 1971759
- 575 S Main St
- 738 Beacon Valley Rd Unit 740
- 36 Hillview St
- 48 High St
- 405 Cherry St
- 216 May St
- 46 Mulberry St
- 23 Ward St
- 167 Cherry St
- 44 Warren Ave
- 70 Warren Ave
- 38 Warren Ave
- 57 Warren Ave
- 51 Warren Ave
- 80 Warren Ave
- 81 Warren Ave
- 29 Warren Ave
- 26 Warren Ave
- 26 Warren Ave Unit 1
- 94 Warren Ave
- 93 Warren Ave
- 880 New Haven Rd
- 100 Warren Ave
- 868 New Haven Rd
- 108 Warren Ave
- 103 Warren Ave
- 894 New Haven Rd
- 866 New Haven Rd
- 866 New Haven Rd Unit 3 fl